Matlab画直方图
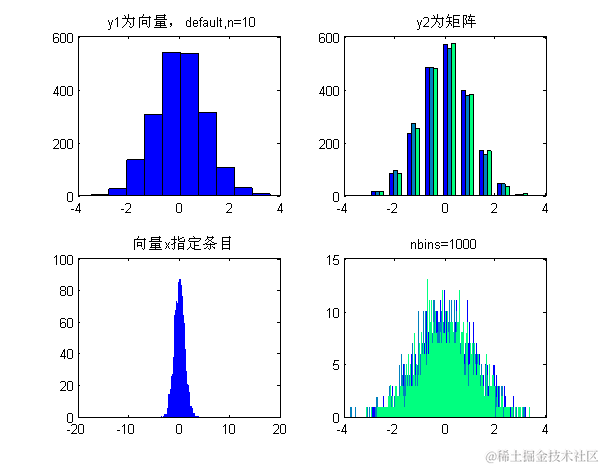
| 1234567891011121314151617181920 | %% 绘制统计直方图``%hist(y):如果y是向量,则把其中元素放入``10``个条目中,且返回每条中的元素的个数;如果y为矩阵,则分别对每列进行处理,显示多组条形。``%[n,xout]=hist(y,x):非递减向量x的指定bin的中心。向量xout包含频率计数与条目的位置。``x=-``10``:.``1``:``10``;``y1=randn(``2008``,``1``);``y2=randn(``2008``,``3``);``figure;``colormap(winter);``subplot(``2``,``2``,``1``);``hist(y1);%把其中元素放入``10``个条目中``title(``'y1为向量,default,n=10'``);``subplot(``2``,``2``,``2``);``hist(y2);%分别对每列进行处理,显示多组条形``title(``'y2为矩阵'``);``subplot(``2``,``2``,``3``);``hist(y1,x);%用户也可以使用[n,xout]=hist(y1,x);bar(xout,n)绘制条形直方图``title(``'向量x指定条目'``);``subplot(``2``,``2``,``4``);``hist(y2,``1000``);%第二个参数为标量时指定bin的数目``title(``'nbins=1000'``); |
|---|
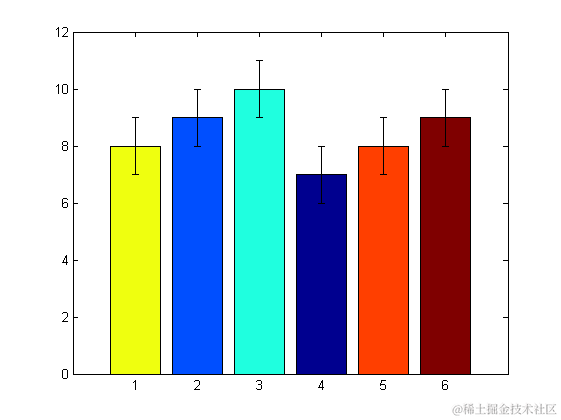
| 123456789 | %% ========均值方差直方图========``a=[``8 9 10 7 8 9``];%mean``b=[``1 1 1 1 1 1``];%std``figure();``h=bar(a);``ch=get(h,``'children'``);``set(ch,``'FaceVertexCData'``,[``4``;``2``;``3``;``1``;``5``;``6``]);%使用Indexed形式指定每组bar的颜色``hold on;``errorbar(a,b,``'k'``,``'LineStyle'``,``'none'``); |
|---|
| 123456789101112131415161718192021222324 | %% =======散点图scatter , scatter3 , plotmatrix======``%scatter3(X,Y,Z,S,C):在由向量X、Y和Z指定的位置显示大小和颜色分别由S和C决定的离散点``figure;``[x,y,z] = sphere(``16``);``X = [x(:)*.``5 x(:)*.``75 x(:)];``Y = [y(:)*.``5 y(:)*.``75 y(:)];``Z = [z(:)*.``5 z(:)*.``75 z(:)];``S = repmat([``10 2 5``]*``10``,numel(x),``1``);``C = repmat([``1 2 3``],numel(x),``1``);``subplot(``1``,``2``,``1``);``scatter(X(:),Y(:),S(:),C(:));``title(``'scatter'``);``subplot(``1``,``2``,``2``);``scatter3(X(:),Y(:),Z(:),S(:),C(:),``'filled'``), view(-``60``,``60``);``title(``'scatter3'``);``%plotmatrix(X,Y)绘出X(p*M)与Y(p*N)的列组成的散度图(N,M)``figure;``X=randn(``100``,``2``);Y=randn(``100``,``2``);``subplot(``1``,``3``,``1``),plotmatrix(X);%等价于plotmatrix(X,X),除了对角上的图为X每一列的直方图hist(X(:,col))``title(``'plotmatrix(X)'``);``subplot(``1``,``3``,``2``),plotmatrix(X,X);``title(``'plotmatrix(X,X)'``);``subplot(``1``,``3``,``3``),plotmatrix(X,Y);``title(``'plotmatrix(X,Y)'``); |
|---|


