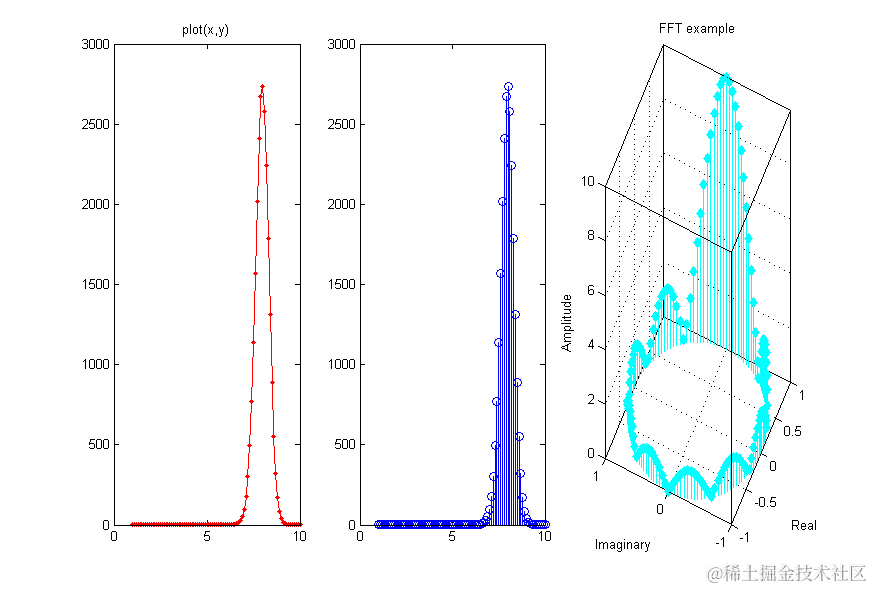
Matlab绘制离散数据杆状图
| 123456789101112131415161718192021222324252627 | %% =======绘制离散数据杆状图===========``%stem和stem3函数用于绘制二维或三维的离散数据杆状图``%stem(Y)可以理解成绘制离散点的plot(y)函数``%stem(X,Y)可以理解成绘制离散点的plot(x,y)函数``%stem(...,``'filled'``)改变数据点显示的空、实状态。``%stem(...,``'LINESPEC'``)Linespec代表直线属性设置参量。``x=``1``:.``1``:``10``;``y=exp(x.*sin(x));``figure;``subplot(``1``,``3``,``1``);``plot(x,y,``'.-r'``);``title(``'plot(x,y)'``);``subplot(``1``,``3``,``2``);``stem(x,y,``'b'``);``subplot(``1``,``3``,``3``);``stem(x,y,``':g'``,``'fill'``);``%绘制三维离散杆状图``th=(``0``:``127``)/``128``*``2``*pi;% 角度采样点``x=cos(th);``y=sin(th);``f=abs(fft(ones(``10``,``1``),``128``)); %对离散方波进行 FFT 变换,并取幅值``stem3(x,y,f``','``cd``','``fill');%绘制图形``view([-``65 30``]);``xlabel(``'Real'``); %图形标注``ylabel(``'Imaginary'``);``zlabel(``'Amplitude'``);``title(``'FFT example'``); |
|---|