Matlab绘制方向和速度矢量图
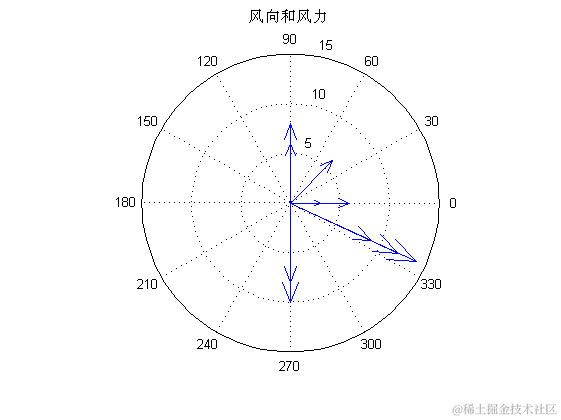
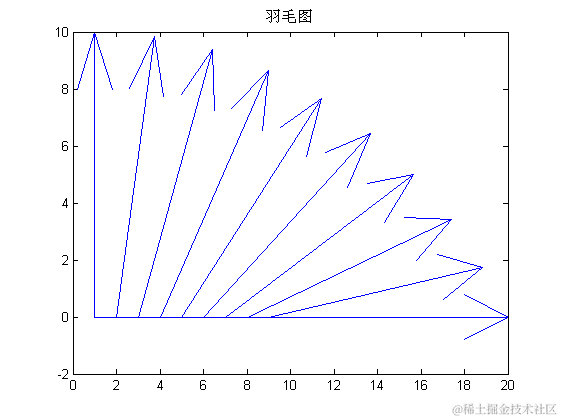
| 12345678910111213141516171819202122232425262728293031323334353637383940414243444546 | %% =======绘制方向和速度矢量图=======``%compass-绘制罗盘图``%feather-绘制羽毛图``%quiver-绘制二维箭头图``%quiver3-绘制三维箭头图``%绘制罗盘图``figure;``wdir=[``45 90 90 45 360 335 360 270 335 270 335 335``];``knots=[``6 6 8 6 3 9 6 8 9 10 14 12``];``rdir=wdir*pi/``180``;``[x,y]=pol2cart(rdir,knots);% 极坐标转化为直角坐标``compass(x,y);``title(``'风向和风力'``)``%绘制羽毛图``figure;``alpha=``90``:-``10``:``0``;``r=ones(size(alpha));``m=alpha*pi/``180``;``n=r*``10``;``[u,v]=pol2cart(m,n);% 极坐标转化为直角坐标``feather(u,v);``title(``'羽毛图'``)``%罗盘图和羽毛图的比较``figure;``t=-pi/``2``:pi/``12``:pi/``2``; % 在 区间,每 取一点。``r=ones(size(t)); % 单位半径``[x,y]=pol2cart(t,r); % 极坐标转化为直角坐标``subplot(``1``,``2``,``1``),compass(x,y),title(``'Compass'``)``subplot(``1``,``2``,``2``),feather(x,y),title(``'Feather'``)``%绘制箭头图``figure;``[x,y] = meshgrid(-``2``:.``2``:``2``,-``1``:.``15``:``1``);``z = x .* exp(-x.^``2 - y.^``2``);``[px,py] = gradient(z,.``2``,.``15``);``subplot(``1``,``2``,``1``);``contour(x,y,z), hold on``quiver(x,y,px,py), hold off, axis image``title(``'quiver示例'``);``[x,y,z]=peaks(``15``);``[nx,ny,nz]=surfnorm(x,y,z);%surfnorm求平面的法向量``subplot(``1``,``2``,``2``)``surf(x,y,z);``hold on;``quiver3(x,y,z,nx,ny,nz);``title(``'quiver3示例'``); |
|---|