Matlab极坐标画图
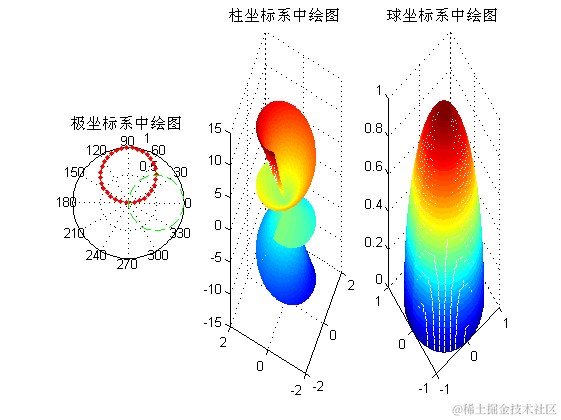
| 12345678910111213141516171819202122232425262728293031 | %% ==========在特殊坐标系中绘制特殊图形。=======``%利用polar函数在极坐标系中绘制图形``figure;``theta=``0``:.``1``:pi;``rho1=sin(theta);``rho2=cos(theta);``subplot(``1``,``3``,``1``);``polar(theta,rho1,``'.-r'``);``hold on;``polar(theta,rho2,``'--g'``);``title(``'极坐标系中绘图'``);``%另外一种和极坐标有关系的坐标系就是柱坐标系了``theta=``0``:pi/``100``:``3``*pi;``rho=sin(theta)+cos(theta);``[t,r]=meshgrid(theta,rho);``z=r.*t;``subplot(``1``,``3``,``2``);``[x,y,z]=pol2cart(t,r,z);%极坐标系向柱坐标系转化``mesh(x,y,z);%柱坐标系中进行绘图``title(``'柱坐标系中绘图'``);``view([-``65 30``]);``%将球坐标系转换为柱面坐标系``subplot(``1``,``3``,``3``);``delta=pi/``100``;``theta=``0``:delta:pi; % theta is zenith angle``phi=``0``:delta:pi; % phi is azimuth angle``[t p]=meshgrid(theta,phi);``r=ones(size(t));``[x,y,z]=sph2cart(t,p,r);%球坐标向柱坐标转化``mesh(x,y,z);%球坐标系中进行绘图``title(``'球坐标系中绘图'``); |
|---|