Matlab 柱形图画法
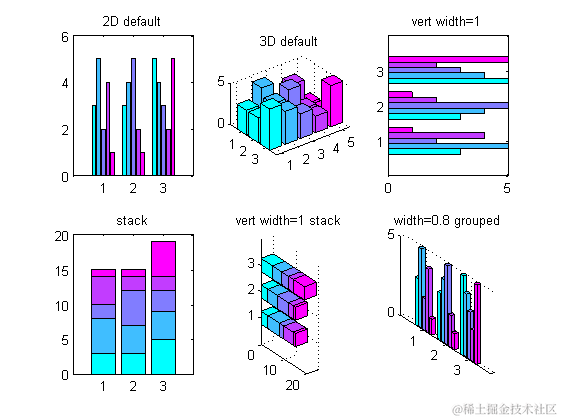
| 1234567891011121314151617181920212223 | <br data-filtered=``"filtered"``>%% 直方图图的绘制``%直方图有两种图型:垂直直方图和水平直方图。而每种图型又有两种表现模式:累计式:分组式。``figure;``z=[``3``,``5``,``2``,``4``,``1``;``3``,``4``,``5``,``2``,``1``;``5``,``4``,``3``,``2``,``5``]; % 各因素的相对贡献份额``colormap(cool);% 控制图的用色``subplot(``2``,``3``,``1``);``bar(z);%二维分组式直方图,默认的为``'group'``title(``'2D default'``);``subplot(``2``,``3``,``2``);``bar3(z);%三维的分组式直方图``title(``'3D default'``);``subplot(``2``,``3``,``3``);``barh(z,``1``);%分组式水平直方图,宽度设置为``1``title(``'vert width=1'``);``subplot(``2``,``3``,``4``);``bar(z,``'stack'``);%累计式直方图,例如:``1``,``1``+``2``,``1``+``2``+``3``构成了第一个bar``title(``'stack'``)``subplot(``2``,``3``,``5``);``bar3h(z,``0.5``,``'stacked'``);%三维累计式水平直方图``title(``'vert width=1 stack'``);``subplot(``2``,``3``,``6``);``bar3(z,``0.8``,``'grouped'``);%对相关数据的颜色进行分组,默认的位``'group'``title(``'width=0.8 grouped'``); |
|---|
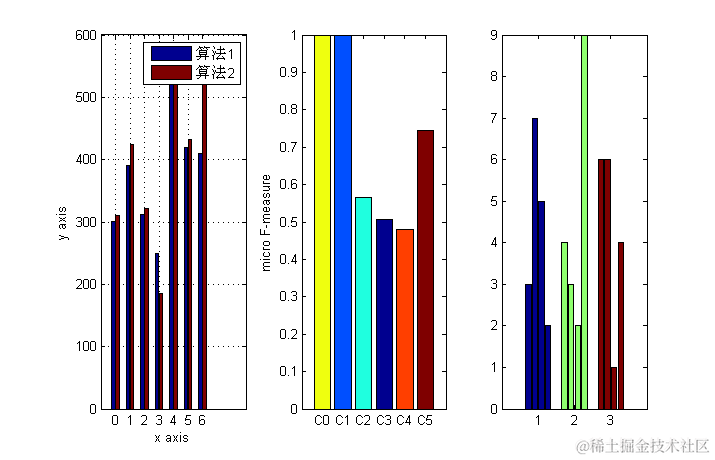
| 12345678910111213141516171819202122232425262728 | %% =========柱状图的进阶==========``figure;``y=[``300 311``;``390 425`` ; ``312 321`` ; ``250 185`` ; ``550 535`` ; ``420 432`` ; ``410 520``;];``subplot(``1``,``3``,``1``);``b=bar(y);``grid on;``set(gca,``'XTickLabel'``,{``'0'``,``'1'``,``'2'``,``'3'``,``'4'``,``'5'``,``'6'``})``legend(``'算法1'``,``'算法2'``);``xlabel(``'x axis'``);``ylabel(``'y axis'``);``%使仅有的一组柱状图呈现不同颜色,默认的位相同颜色``data = [``1.0`` , ``1.0`` , ``0.565`` , ``0.508`` , ``0.481`` , ``0.745``];``subplot(``1``,``3``,``2``);``b = bar(data);``ch = get(b,``'children'``);``set(ch,``'FaceVertexCData'``,[``4``;``2``;``3``;``1``;``5``;``6``]);%使用Indexed形式指定每组bar的颜色``set(gca,``'XTickLabel'``,{``'C0'``,``'C1'``,``'C2'``,``'C3'``,``'C4'``,``'C5'``})``axis([``0 7 0.0 1.0``]);``ylabel(``'micro F-measure'``);``%使每个bar颜色不同,默认的是每个元素在不同组的颜色相同``data = [``3`` , ``7`` , ``5`` , ``2``;``4`` , ``3`` , ``2`` , ``9``;``6`` , ``6`` , ``1`` , ``4``];``subplot(``1``,``3``,``3``);``b = bar(data);``ch = get(b,``'children'``);``set(ch{``1``},``'FaceVertexCData'``,[``1``;``2``;``3``]);%设置第一个元素在不同组的颜色``set(ch{``2``},``'FaceVertexCData'``,[``1``;``2``;``3``]);%设置第二个元素在不同组的颜色``set(ch{``3``},``'FaceVertexCData'``,[``1``;``2``;``3``]);``set(ch{``4``},``'FaceVertexCData'``,[``1``;``2``;``3``]); |
|---|
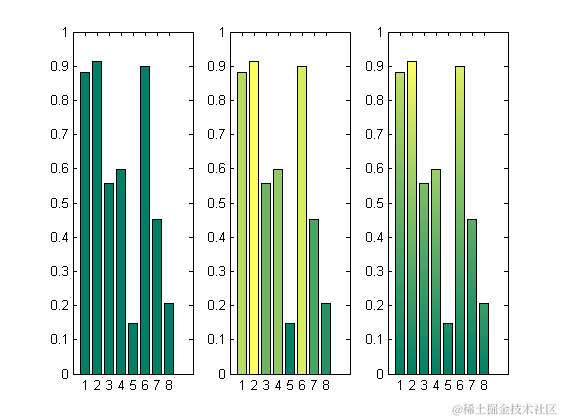
| 12345678910111213141516171819202122232425262728293031323334353637383940414243444546474849505152 | %% 彩色柱状图``%用到的数据`` n = ``8``;``Z = rand(n,``1``);``figure;``%默认图片``subplot(``1``,``3``,``1``);``bar(Z);``%简单的作图``% 这个图根据数据列中值的大小着色。每列中的值越大,颜色越突出``subplot(``1``,``3``,``2``);``h=bar(Z);``colormap(summer(n));``ch = get(h,``'Children'``);``fvd = get(ch,``'Faces'``);%针对矩阵时,只能用fvd=get(ch{col},``'Faces'``),下同``fvcd = get(ch,``'FaceVertexCData'``);``[~, izs] = sortrows(Z,``1``);``for i = ``1``:n`` ``row = izs(i);`` ``fvcd(fvd(row,:)) = i;``end``set(ch,``'FaceVertexCData'``,fvcd)``%图片会以渐变的方式着色,效果非常不错``subplot(``1``,``3``,``3``);``h=bar(Z);``ch = get(h,``'Children'``);``fvd = get(ch,``'Faces'``);``fvcd = get(ch,``'FaceVertexCData'``);``[zs, izs] = sortrows(Z,``1``);`` k = ``128``; % 准备生成``128 *``3 行的colormap``colormap(summer(k)); % 这样会产生一个``128 * ``3``的矩阵,分别代表[R G B]的值``% 检视数据``whos ch fvd fvcd zs izs``% Name Size Bytes Class Attributes``%`` % ch 1x1 ``8 double`` % fvcd 66x1 ``528 double`` % fvd 13x4 ``416 double`` % izs 13x1 ``104 double`` % zs 13x1 ``104 double``%``shading interp % Needed to graduate colors``for i = ``1``:n`` ``color = floor(k*i/n); % 这里用取整函数获得color在colormap中行`` ``row = izs(i); % Look up actual row # in data`` ``fvcd(fvd(row,``1`` )) = ``1``; % Color base vertices 1st index`` ``fvcd(fvd(row,``4`` )) = ``1``;`` ``fvcd(fvd(row,``2``)) = color; % Assign top vertices color`` ``fvcd(fvd(row,``3``)) = color;``end``set(ch,``'FaceVertexCData'``, fvcd); % Apply the vertex coloring``set(ch,``'EdgeColor'``,``'k'``); |
|---|