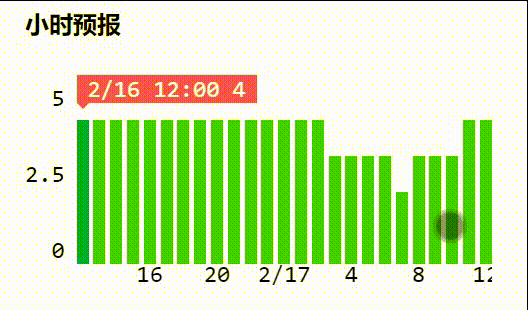
效果图
WXML
<view class="slide-container" style="height: {{chartHeight}}rpx">
<view class="slide-y-axis" wx:if="{{showYAxis}}" style="height:{{YAxisHeight}}rpx">
<view wx:for="{{YAxis}}" wx:key="index">{{item}}</view>
</view>
<scroll-view
scroll-x
enhanced="{{true}}"
show-scrollbar="{{false}}"
scroll-with-animation
bindscroll="scroll"
style="overflow: scroll;"
>
<view class="slide-charts" style="height: {{chartHeight}}rpx;">
<view class="slide-chart-item" wx:for="{{chartData}}" wx:key="index">
<view
class="slide-bar {{index==currentIndex?'active': ''}}"
style="height:{{item.height}}rpx"
>
<view class="tip" style="left: {{item.left}}px" hidden="{{index!==currentIndex}}">
<view class="tip-content">{{item.date}} {{item.hour}}:00 {{item.value}}</view>
<view
class="tip-triangle"
style="left: {{-item.left}}px;border-width: {{barVisWidth / 2}}px"
></view>
</view>
</view>
<view
class="slide-x-axis"
hidden="{{item.hour % 4 !== 0 || index === 0 || index === chartData.length - 1}}"
>{{item.hour === 0?item.date:item.hour}}</view
>
</view>
</view>
</scroll-view>
</view>
WXSS
.slide-container {
display: flex;
align-items: flex-end;
font-family: 'Consolas';
}
.slide-y-axis {
display: flex;
flex-direction: column;
justify-content: space-between;
align-items: flex-end;
margin-right: 0.5em;
margin-bottom: 1em;
}
.slide-charts {
display: flex;
align-items: stretch;
}
.slide-chart-item {
display: flex;
flex-direction: column;
align-items: center;
justify-content: flex-end;
flex: 0 0 0.5em;
}
.slide-chart-item:not(:last-of-type) {
padding-right: 0.2em;
}
.slide-bar {
background-color: #3cd500;
transition: all 0.2s linear;
position: relative;
width: 100%;
margin-top: 0.5em;
margin-bottom: 1em;
}
.slide-bar.active {
background-color: #01a84c;
}
.slide-x-axis {
position: absolute;
}
.tip {
background-color: #f55555;
color: #fff;
white-space: nowrap;
position: absolute;
top: -60rpx;
width: 240rpx;
z-index: 2;
}
.tip>.tip-content {
text-align: center;
}
.tip > .tip-triangle {
width: 0;
height: 0;
border-left: solid transparent;
border-right: solid transparent;
border-top: solid #f55555;
position: absolute;
top: 100%;
}
JS
function ceilToTen(n) {
return Math.ceil(n / 5) * 5;
}
Component({
properties: {
chartData: Array,
chartHeight: {
type: Number,
value: 300,
},
showYAxis: {
type: Boolean,
value: true,
},
},
data: {
YAxis: [],
YAxisHeight: 0,
currentIndex: 0,
scrollWidth: 0,
scrollEnd: 0,
barWidth: 0,
barVisWidth: 0,
},
lifetimes: {
ready() {
const height = this.data.chartHeight - 60;
const data = this.data.chartData;
const value = data.map(e => e.value);
const Max = ceilToTen(Math.max(...value));
data.forEach(e => {
e.height = height * (e.value / Max);
});
this.setData({
chartData: data,
YAxis: [Max, Max / 2, 0],
YAxisHeight: height,
});
this.createSelectorQuery()
.in(this)
.selectAll('.slide-chart-item')
.boundingClientRect(rect => {
this.setData({
scrollWidth: rect.length * rect[0].width,
barWidth: rect[0].width,
});
})
.exec();
this.createSelectorQuery()
.in(this)
.select('.slide-bar')
.boundingClientRect(rect => {
this.setData({
barVisWidth: rect.width,
});
})
.exec();
this.createSelectorQuery()
.in(this)
.select('.slide-charts')
.boundingClientRect(rect => {
this.setData({
scrollEnd: this.data.scrollWidth - rect.width,
});
})
.exec();
this.createSelectorQuery()
.in(this)
.select('.tip')
.boundingClientRect(rect => {
const width = rect.width - this.data.barVisWidth;
const tipWidth = rect.width - 2 * this.data.barVisWidth;
const data = this.data.chartData;
const count = data.length - 1;
data.forEach((e, i) => {
e.left = -width * (i / count);
e.tipLeft = tipWidth * (i / count);
});
this.setData({
chartData: data,
});
})
.exec();
},
},
methods: {
scroll(e) {
if (e.detail.scrollLeft <= this.data.scrollEnd) {
const percent = e.detail.scrollLeft / this.data.scrollEnd;
const loc = this.data.scrollWidth * percent;
const currentIndex = Math.floor(loc / this.data.barWidth);
this.setData({ currentIndex });
}
},
},
});


