<!DOCTYPE HTML PUBLIC "-//W3C//DTD XHTML 1.0 Transitional//EN" "http://www.w3.org/TR/xhtml1/DTD/xhtml1-transitional.dtd">
<html xmlns="http://www.w3.org/1999/xhtml">
<head>
<title>GeoJson显示示例</title>
<meta http-equiv="Content-type" content="text/html; charset=utf-8" />
<link href="../../libs/leaflet/leaflet.css" rel="Stylesheet" type="text/css" />
<script src="../../libs/leaflet/leaflet.js" type="text/javascript"></script>
<style type="text/css">
* {
padding: 0;
margin: 0;
}
html, body, #leaf_map {
width: 100%;
height: 100%;
}
</style>
<script type="text/javascript">
"use strict";
function init() {
var map = L.map('leaf_map', {
crs: L.CRS.EPSG3857,
attributionControl: false,
center: [30.5217, 114.3948],
minZoom: 0,
maxZoom: 18,
zoom: 18
});
var vecLayer = L.tileLayer("http://t0.tianditu.gov.cn/DataServer?T=vec_w&x={x}&y={y}&l={z}&tk=55b4d4eaef95384c946e9bd1b99c5610", { noWrap: true }).addTo(map);
var cvaLayer = L.tileLayer("http://t0.tianditu.gov.cn/DataServer?T=cva_w&x={x}&y={y}&l={z}&tk=55b4d4eaef95384c946e9bd1b99c5610", { noWrap: true }).addTo(map);
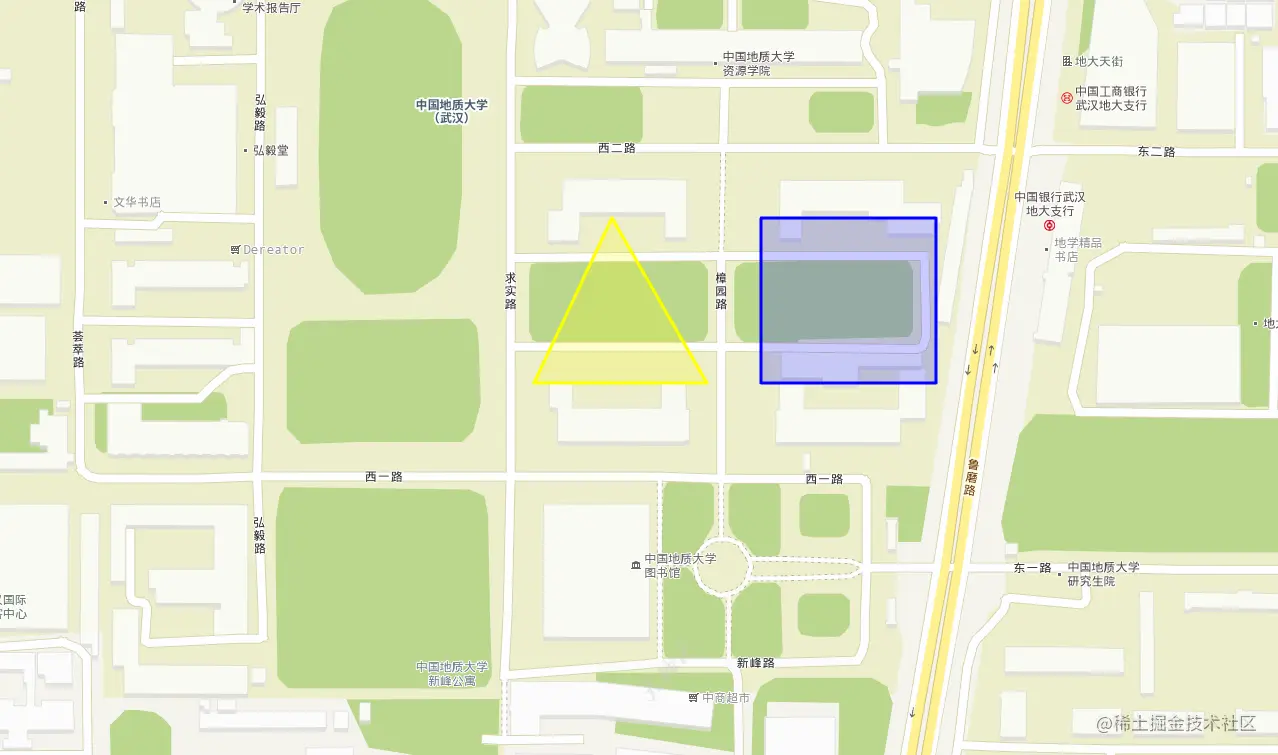
var data = [{
"type": "Feature",
"properties": { "party": "Republican", "name": "三角形" },
"geometry": {
"type": "Polygon",
"coordinates": [[
[114.39386, 30.52254],
[114.39344, 30.52178],
[114.39437, 30.52178],
]]
}
},
{
"type": "Feature",
"properties": { "party": "Democrat", "name": "矩形" },
"geometry": {
"type": "Polygon",
"coordinates": [[
[114.39466, 30.52254],
[114.3956, 30.52254],
[114.3956, 30.52178],
[114.39466, 30.52178],
]]
}
}];
L.geoJSON(data, {
style: function (feature) {
switch (feature.properties.party) {
case 'Republican': return { color: "yellow" };
case 'Democrat': return { color: "#0000ff" };
}
}
}).on('mouseover', function (e) {
var type = e.layer.feature.properties.name;
L.popup().setContent(type)
.setLatLng(e.latlng)
.openOn(map);
}).addTo(map);
}
</script>
</head>
<body onload="init()">
<div id="leaf_map">
</div>
</body>
</html>


