<template>
<div ref="chart" :style="{ width, height }" class="container"></div>
</template>
<script>
export default {
props: {
width: {
type: String,
default: "500px",
},
height: {
type: String,
default: "300px",
},
data: {
type: Array,
required: true,
},
options: {
required: true,
},
},
mounted() {
let option1 = {
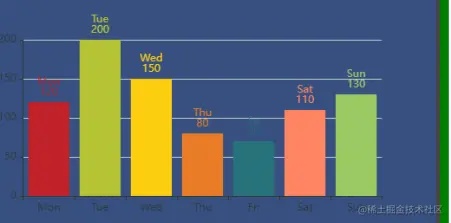
xAxis: {
type: "category",
data: ["Mon", "Tue", "Wed", "Thu", "Fri", "Sat", "Sun"],
},
yAxis: {
type: "value",
},
series: [
{
data: [120, 200, 150, 80, 70, 110, 130],
type: "bar",
itemStyle: {
normal: {
color: function (params) {
var colorList = [
"#C1232B",
"#B5C334",
"#FCCE10",
"#E87C25",
"#27727B",
"#FE8463",
"#9BCA63",
"#FAD860",
"#F3A43B",
"#60C0DD",
"#D7504B",
"#C6E579",
"#F4E001",
"#F0805A",
"#26C0C0",
];
return colorList[params.dataIndex];
},
label: {
show: true,
position: "top",
formatter: "{b}\n{c}",
},
},
},
},
],
};
this.initChart(this.$refs.chart, option1, (data) => {
console.log(data);
});
},
};
</script>
<style lang="scss" scoped >
.container {
width: 500px;
height: 300px;
}
</style>


