methods: {
drawFunnel() {
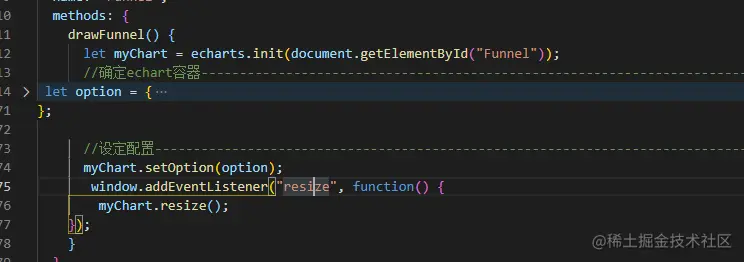
let myChart = echarts.init(document.getElementById("Funnel"));
//确定echart容器--------------------------------------------------------------------------------------------------------------------------------------
let option = {
geo: {
map: 'china',
label: {
normal: {
show: true
},
emphasis: {
show: false
}
},
itemStyle: {
normal: {
color: '#45aaf2', //地图背景色
borderColor: '#516a89', //省市边界线00fcff 516a89
borderWidth: 1
},
emphasis: {
color: '#fff' //悬浮背景
}
}
},
series: {
type: 'scatter',
coordinateSystem: 'geo',
zlevel: 2,
rippleEffect: {
period: 4,
brushType: 'stroke',
scale: 4
},
label: {
normal: {
show: true,
formatter: '{b}',
textStyle: {
color: "#fff"
}
},
emphasis: {
show: true,
color: "#fff"
}
},
symbol: 'arrow',
symbolSize: 50,
data: [{
name: '昌平',
value: [116.4551, 40.2539, 10]
}, {
name: '临沂',
value: [118.1582, 36.8701, 10]
}, {
name: '南昌',
value: [116.0046, 28.6633, 10]
}],
}
};
//设定配置-------------------------------------------------------------------------------------------------------------------------------------------------
myChart.setOption(option);
window.addEventListener("resize", function() {
myChart.resize();
});
}
},


