安装echarts指令
npm install echarts --save
template 写入div标签
<template>
<div>
<div id="myChart" :style="{ width: '100%', height: '300px' }"></div>
</div>
<template>
Vue3 setup下使用echarts
<script setup>
import * as echarts from "echarts";
onMounted(() => {
setTimeout(() => {
line();
}, 1000);
});
const line = () => {
let myChart = echarts.init(document.getElementById("myChart"));
myChart.setOption({
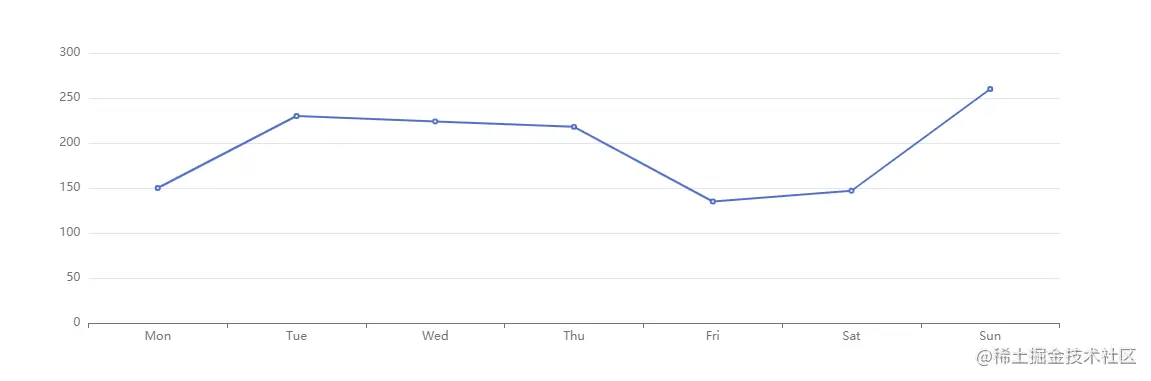
xAxis: {
type: "category",
data: ["Mon", "Tue", "Wed", "Thu", "Fri", "Sat", "Sun"],
},
yAxis: {
type: "value",
},
series: [
{
data: [150, 230, 224, 218, 135, 147, 260],
type: "line",
},
],
});
window.onresize = function () {
myChart.resize();
};
};
</script>