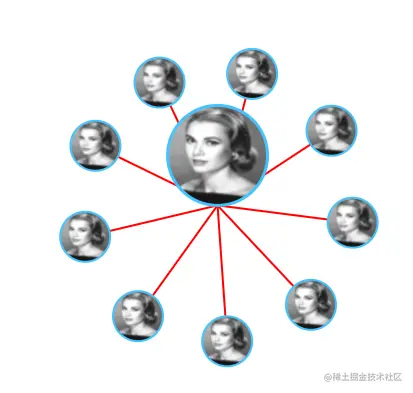
已d3js为例。已知力导向图线条坐标,实现使节点不改变角度平移
原始效果
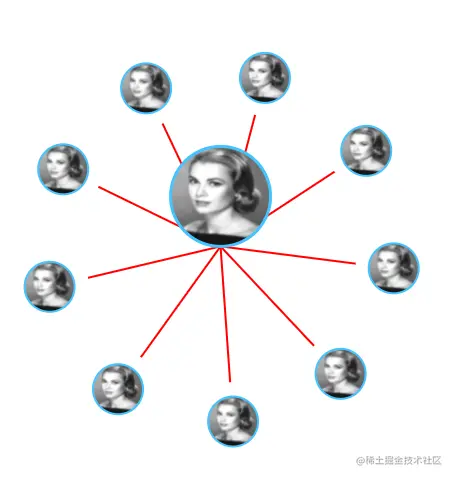
要实现的效果
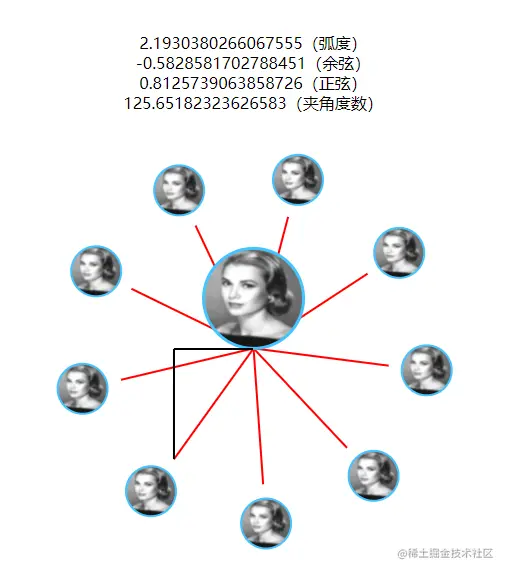
实现思路:
- 每条线把它想成是直角三角形
- 计算出三角形对边边长和邻边边长。
- 反正切(Math.atan2)计算出夹角的弧度。
- 使用弧度计算正、余弦。x轴使用余弦值,y轴使用正弦值
- cos or sin(正、余弦值) * size(大小) + center(中心点坐标)
公式实现:
弧度 = Math.atan2(y2 - y1(对边长), x2 - x1(邻边长))
余弦值 = Math.cos(弧度)
正弦值 = Math.sin(弧度)
坐标 = cos or sin * size + center
完整代码
<!DOCTYPE html>
<html lang="en">
<head>
<meta charset="UTF-8">
<title>Title</title>
</head>
<body>
<div></div>
<script src="https://d3js.org/d3.v6.min.js"></script>
<script>
let dataset = {
nodes: [
{name: "Adam"},
{name: "Bob"},
{name: "Carrie"},
{name: "Donovan"},
{name: "Edward"},
{name: "Felicity"},
{name: "George"},
{name: "Hannah"},
{name: "Iris"},
{name: "Jerry"}
],
edges: [
{source: 0, target: 1},
{source: 0, target: 2},
{source: 0, target: 3},
{source: 0, target: 4},
{source: 0, target: 5},
{source: 0, target: 6},
{source: 0, target: 7},
{source: 0, target: 8},
{source: 0, target: 9},
]
};
let w = 800
let h = 800
let colors = d3.scaleOrdinal(d3.schemeCategory10);
let force = d3.forceSimulation(dataset.nodes)
.force('charge', d3.forceManyBody().strength(-400))
.force('link', d3.forceLink(dataset.edges).distance(120))
.force('center', d3.forceCenter().x(w / 2).y(h / 2))
let svg = d3.select('div')
.append('svg')
.attr('width', w)
.attr('height', h)
let defs = svg.append('defs')
defs.selectAll('pattern')
.data(dataset.nodes)
.enter()
.append('pattern')
.attr('id', function (d, i) {
return `circleImage${i}`
})
.attr('patternUnits', 'objectBoundingBox')
.attr('width', '100%')
.attr('height', '100%')
.append('image')
.attr('preserveAspectRatio', 'none')
.attr('height', f)
.attr('width', f)
.attr('xlink:href', 'test.jpg')
let edges = svg.selectAll('line')
.data(dataset.edges)
.enter()
.append('line')
.style('stroke-width', 2)
.attr('stroke', 'red')
function f(d, i) {
if (i) {
return 50
} else {
return 100
}
}
let circle = svg.selectAll('circle')
.data(dataset.nodes)
.enter()
.append('circle')
.attr('r', function (d, i) {
if (i) {
return 25
} else {
return 50
}
})
.attr('fill', function (d, i) {
return `url(#circleImage${i})`
})
.attr('stroke-width', 2)
.text((d) => d.name)
let pathX = svg.append('line')
.attr('stroke-width', 2)
let pathY = svg.append('line')
.attr('stroke-width', 2)
let radText = svg.append('text')
.attr('y', 100)
let cosText = svg.append('text')
.attr('y', 120)
let sinText = svg.append('text')
.attr('y', 140)
let angle = svg.append('text')
.attr('y', 160)
force.on('tick', () => {
edges.attr('x1', (d) => d.source.x)
.attr('y1', (d) => d.source.y)
.attr('x2', (d) => d.target.x)
.attr('y2', (d) => d.target.y)
circle.attr('cx', function (d, i) {
if (i) {
let rad = Math.atan2(d.y - h / 2, d.x - w / 2);
let x = Math.cos(rad)
return x * 175 + w / 2
}
return d.x
}).attr('cy', function (d, i) {
this.setAttribute('stroke', '#45C3FF')
if (i) {
let rad = Math.atan2(d.y - h / 2, d.x - w / 2);
let y = Math.sin(rad);
return y * 175 + h / 2
} else {
this.setAttribute('stroke-width', 3)
return d.y - 50
}
}).on('mouseover', function (e, d) {
let rad = Math.atan2(d.y - h / 2, d.x - w / 2);
let cos = Math.cos(rad);
let sin = Math.sin(rad);
pathX.attr('x1', w / 2)
.attr('y1', h / 2)
.attr('x2', (w / 2) + (d.x - w / 2))
.attr('y2', h / 2)
.attr('stroke', '#000000')
pathY.attr('x1', (w / 2) + (d.x - w / 2))
.attr('y1', h / 2)
.attr('x2', d.x)
.attr('y2', d.y)
.attr('stroke', '#000000')
radText.text(`${rad}(弧度)`)
.attr('x', function () {
return w / 2 - this.getBBox().width / 2
})
cosText.text(`${cos}(余弦)`)
.attr('x', function () {
return w / 2 - this.getBBox().width / 2
})
sinText.text(`${sin}(正弦)`)
.attr('x', function () {
return w / 2 - this.getBBox().width / 2
})
let angel = 360 / (Math.PI * 2) * rad
angle.text(`${angel > 0 ? angel : angel + 360}(夹角度数)`)
.attr('x', function () {
return w / 2 - this.getBBox().width / 2
})
})
})
</script>
</body>
</html>


