第一步安装G2
npm install g2 --save
引入ChinaGeoJSON
<script src="https://a.alipayobjects.com/g/datavis/china-geojson/1.0.0/index.js"></script>
成功安装完成之后,即可使用 import 或 require 进行引用
import G2 from 'g2';
创建 div 图表容器
<div class="map" style="display: flex;">
	<div id="china" style="background:#fff;margin: 20px; padding: 20px; border-radius: 10px"></div>
	<div id="province" style="background:#fff;margin: 20px; padding: 20px; border-radius: 10px"></div>
</div>
编写图表绘制代码
function chartMap() {
function bgData(mapData) {
let result = [];
let features = mapData.features;
for (let i = 0; i < features.length; i++) {
let name = features[i].properties.name;
result.push({
name: name,
});
}
return result;
}
function processData(mapData) {
let result = [];
let features = mapData.features;
for (let i = 0; i < features.length; i++) {
let name = features[i].properties.name;
result.push({
name: name,
value: Math.round(Math.random() * 1000),
});
}
return result;
}
function renderProvinceChart(provinceChart, name) {
let provinceData = window['ChinaGeoJSON'][name];
provinceChart.clear();
provinceChart.source(processData(provinceData));
provinceChart.legend({
position: 'left',
});
provinceChart
.polygon()
.position(Stat.map.region('name', provinceData))
.label('name', {
label: {
fill: '#333',
},
})
.style({
stroke: '#fff',
lineWidth: 1,
})
.color('value', '#e5f5e0-#31a354');
provinceChart.render();
}
let Stat = G2.Stat;
const mapData = window['ChinaGeoJSON'].China;
let chart = new G2.Chart({
id: 'china',
width: 600,
height: 360,
plotCfg: {
margin: [50, 80],
},
});
let bgView = chart.createView();
bgView.source(bgData(mapData));
bgView.tooltip(false);
bgView
.polygon()
.position(Stat.map.region('name', mapData))
.color('#fff')
.style({
stroke: '#333',
lineWidth: 1,
});
let userDataView = chart.createView();
userDataView.source(processData(mapData));
userDataView
.polygon()
.position(Stat.map.region('name', mapData))
.color('value', '#F4EC91-#AF303C')
.label('name', { label: { fill: '#000', shadowBlur: 5, shadowColor: '#fff' } })
.style({
stroke: '#333',
lineWidth: 1,
})
.selected({
mode: 'single',
style: {
fill: '#fe9929',
},
});
chart.render();
let provinceChart = new G2.Chart({
id: 'province',
width: 450,
height: 450,
plotCfg: {
margin: [20, 20, 40, 80],
},
});
let shapeData = chart.getAllGeoms()[0].getData();
for (let i = 0, len = shapeData.length; i < len; i++) {
let item = shapeData[i];
let origin = item['_origin'];
let name = origin.name;
if (name === '浙江') {
renderProvinceChart(provinceChart, name);
chart.getAllGeoms()[0].setSelected(item);
}
}
chart.on('plotclick', function(ev) {
let shape = ev.shape;
if (shape && shape.get('selected')) {
let item = shape.get('origin');
let data = item['_origin'];
let name = data.name;
renderProvinceChart(provinceChart, name);
} else {
provinceChart.clear();
}
});
}
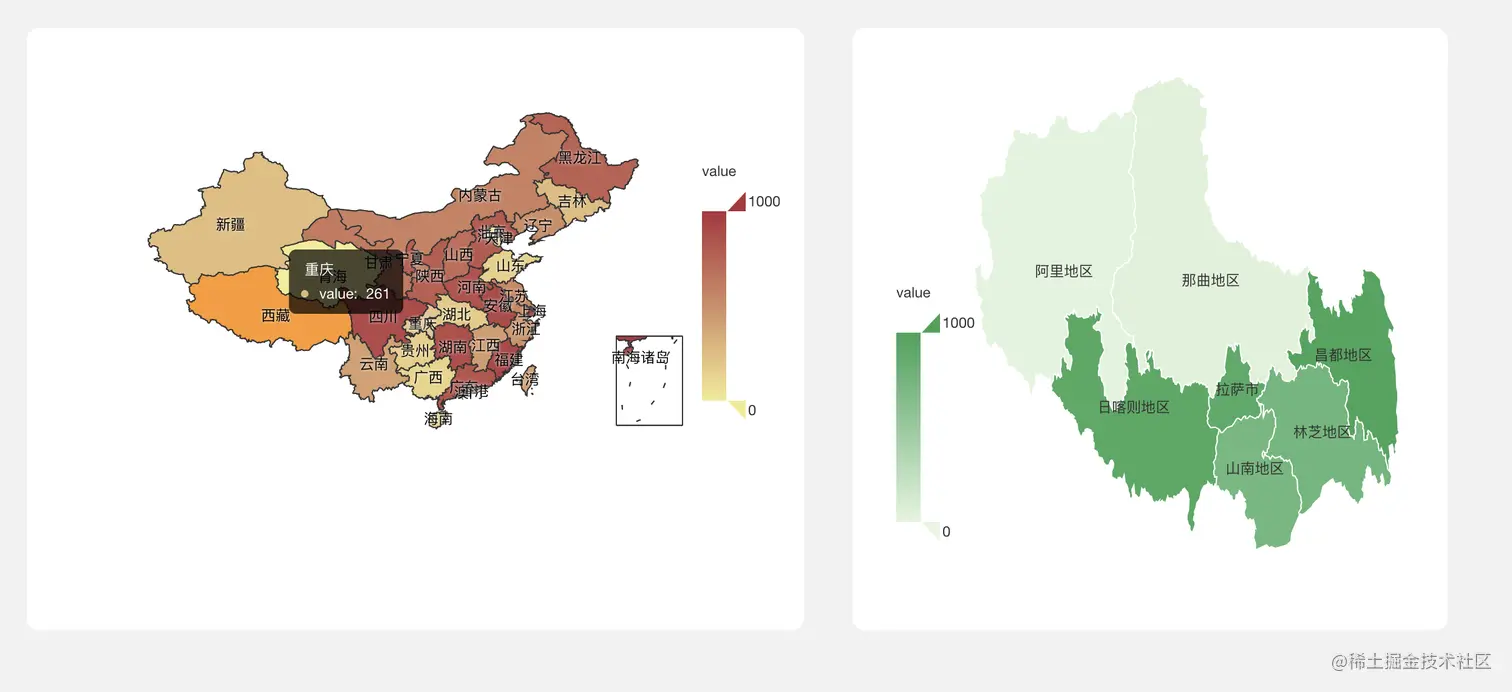
成品效果:左图显示全国数据,右图显示省份数据,点击左图,触发更新右图省份。