import Echarts from "native-echarts";
this.state = {
contentArr: [this.props.index],
// 折线图数据
option: {
title: [
{
text: "┃",
left: 0,
textStyle: {
fontSize: 20,
color: base.tabBgColor,
},
},
{
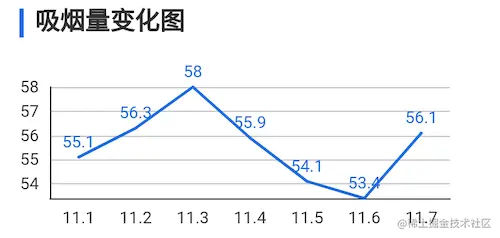
text: "吸烟量变化图",
left: 20,
textStyle: {
fontSize: 18,
},
},
],
color: [base.tabBgColor],
xAxis: {
type: "category",
data: ["11.1", "11.2", "11.3", "11.4", "11.5", "11.6", "11.7"],
axisLine: {
//y轴
show: true,
},
axisTick: {
//y轴刻度线
show: false,
},
splitLine: {
//网格线
show: false,
},
},
yAxis: [
{
type: "value",
min: function(value) {
return value.min - 20;
},
axisLine: {
//y轴
show: true,
},
axisTick: {
//y轴刻度线
show: false,
},
splitLine: {
//网格线
show: true,
},
},
],
series: [
{
data: [55.1, 56.3, 58.0, 55.9, 54.1, 53.4, 56.1],
type: "line",
symbolSize: 1,
symbolKeepAspect: false,
connectNulls: true,
itemStyle: {
normal: {
label: {
show: true,
},
},
},
},
],
},
};
<Echarts option={this.state.option} height={200} width={width} />


