简单增加图例
#直接画
# plt.plot(x,y1,x,y2)
# plt.legend(['cos','sin'])
#每个图加图例,在plot加入参数label
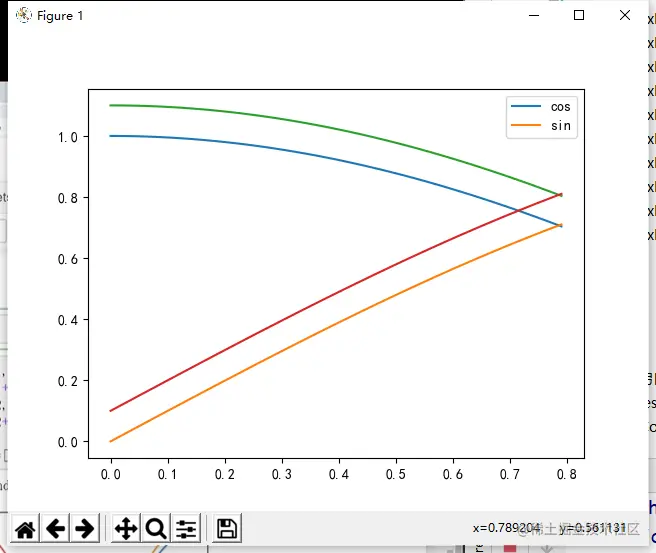
h1,=plt.plot(x,y1,label='cos')#注意非plot图可能返回的只有handle,故不需在h1后加‘,’
h2,=plt.plot(x,y2,label='sin')
plt.legend()
plt.show()
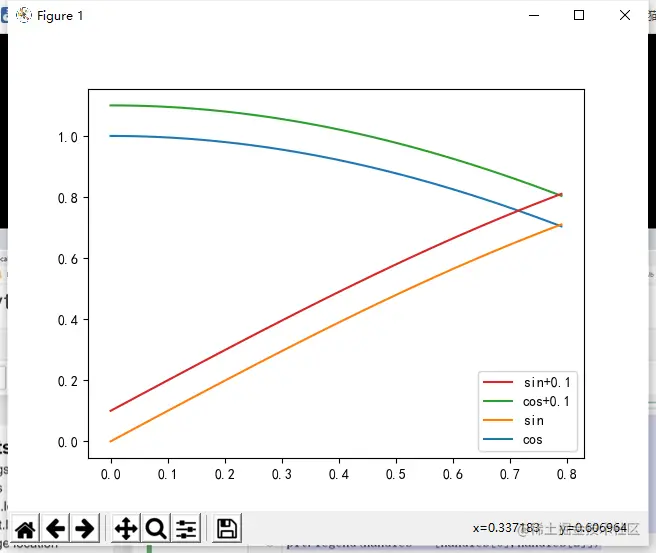
图例的位置
loc
plt.legend(loc='best')#组合:loc(ation)'upper''lower';'center';'right''left'
#plt.legend(loc=(0))
#其他位置
#plt.legend(loc=(a,b))#a,b为图中的坐标
bbox_to_anchor
#bbox_to_anchor:x,y(width,height)两位或四位元组
plt.legend(loc='best',bbox_to_anchor=(0.7,0.8,0.3,0.2))
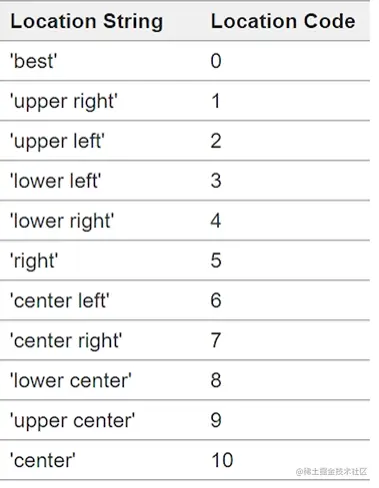
图例的顺序
ax.get_legend_handles_labels()
h3,=plt.plot(x,y1+0.1,label='cos+0.1')
h4,=plt.plot(x,y2+0.1,label='sin+0.1')
ax=plt.gca()#取整个图的句柄
handles,labels=ax.get_legend_handles_labels()#注意handles为list类
plt.legend(handles[::-1],labels[::-1])#handles,labels逆序
# plt.legend(handles=handles[::-1])#仅改变句柄,必须等于list形式
plt.legend(handles=[handles[0],handles[2]])#保留其中的,必须等于list形式
plt.legend(handles=[h1,h2])
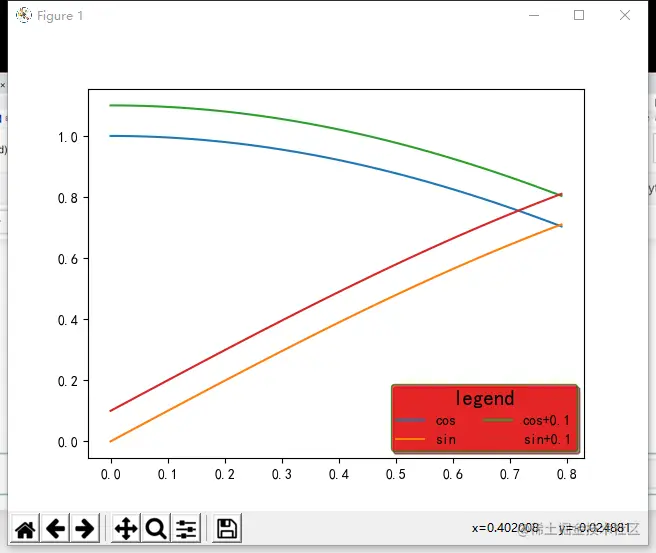
格式:图例标题,字体大小,是否分列
#plt.legend(title='legend',title_fontsize=5)#给图例增加标题,字体的大小
#plt.legend(ncol=2)#对图例进行分列
# plt.legend(frameon=0)#是否有背景框
# plt.legend(framealpha=0.7)#背景框的透明度0-1
# plt.legend(edgecolor='g')#背景框的边缘颜色
# plt.legend(facecolor='red')#背景颜色
# plt.legend(shadow=1)#背景框是否有阴影
# plt.legend(fancybox=1)#背景框角是否为圆角
plt.legend(title='legend',title_fontsize=15,ncol=2,frameon=1,framealpha=0.7,edgecolor='g',facecolor='red',shadow=1,fancybox=1)#给图例增加标题,字体的大小