1/简介
这一篇文章主要介绍关于主成分分析PCA的一个应用, 主要看一下在实战的时候应该如何来进行
我们使用sklearn中自带的iris数据集进行测试, 会对PCA降维后的结果进行可视化
2/导入原始数据集
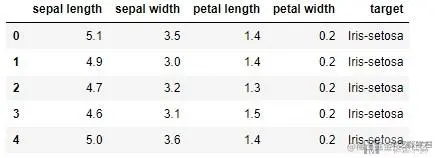
接着我们导入数据集, 使用iris的数据集.
df = pd.read_csv("./iris.csv")
print( df.head() )
一共有4列特征, 1列标签,共150行数据, 数据如下:
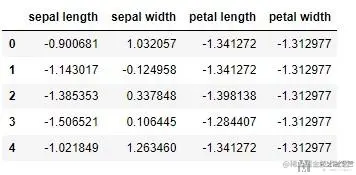
3/特征数据标准化
数据的量纲会影响pca的结果, 所以在做之前, 我们需要先对数据进行标准化处理。
我们使用StandardScaler进行标准化, 标准化之后变为均值为0, 方差为1的数据
features = ['sepal length', 'sepal width', 'petal length', 'petal width']
x = df.loc[:, features].values
y = df.loc[:,['target']].values
x = StandardScaler().fit_transform(x)
houzhen_df = pd.DataFrame(data=x,columns=features)
print( houzhen_df.head() )
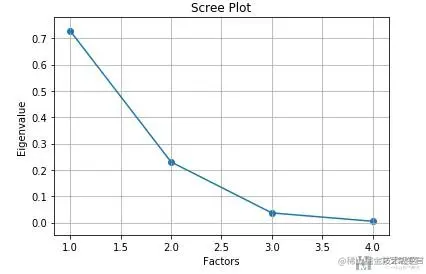
4/计算每个特征的方差占比,然后决定降维后的维数
接着我们看一下降维到多少维度比较合适, 我们看一下每一个变量方差的占比
pca = PCA(n_components=4)
principalComponents = pca.fit_transform(x)
pca.explained_variance_ratio_
因为有2个特征的方差占比<10%,因此我们决定最后降维到4-2=2维
importance = pca.explained_variance_ratio_
plt.scatter(range(1,5),importance)
plt.plot(range(1,5),importance)
plt.title('Scree Plot')
plt.xlabel('Factors')
plt.ylabel('Eigenvalue')
plt.grid()
plt.show()
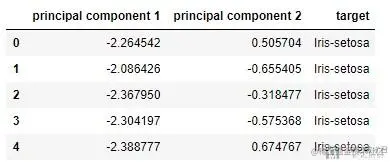
5/使用PCA降维
pca = PCA(n_components=2)
principalComponents = pca.fit_transform(x)
principalDf = pd.DataFrame(data=principalComponents,
columns=['principal component 1', 'principal component 2'])
final_data_df = pd.concat([principalDf, df[['target']]], axis = 1)
final_data_df.head(5)
6/查看转换系数
我们知道PCA中的新的变量(主成分)是通过原始变量线性组合而来的,
我们下面看一下他们的系数, 看一下新的变量是否可以进行解释,
首先我们得到转换的系数.
pca.components_
"""
array([[ 0.52237162, -0.26335492, 0.58125401, 0.56561105],
[ 0.37231836, 0.92555649, 0.02109478, 0.06541577]])
"""
我们把系数进行可视化,可以更加容易看出主要成分和那些原始特征有关.
import seaborn as sns
df_cm = pd.DataFrame(np.abs(pca.components_), columns=df.columns[:-1])
plt.figure(figsize = (12,6))
ax = sns.heatmap(df_cm, annot=True, cmap="BuPu")
ax.yaxis.set_tick_params(labelsize=15)
ax.xaxis.set_tick_params(labelsize=15)
plt.title('PCA', fontsize='xx-large')
plt.savefig('factorAnalysis.png', dpi=200)
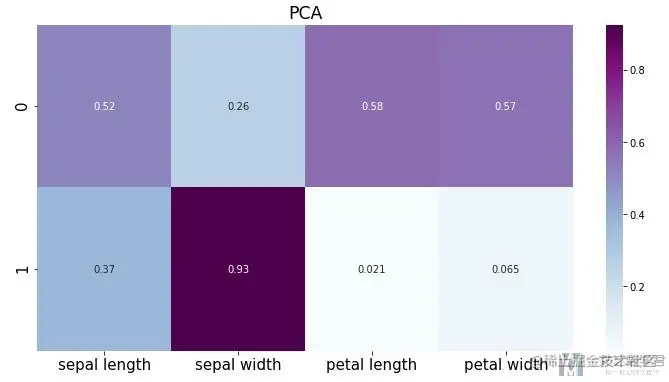
可以看到第二个主成分与第二个原始特征的关系比较大, 第一个主成分与其余三个原始变量关系比较大
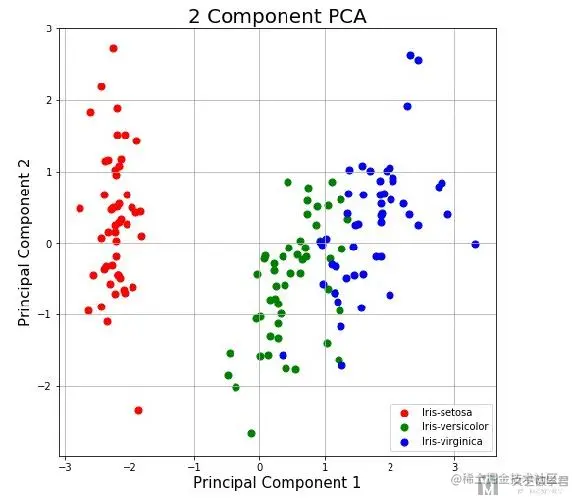
7/数据降维可视化
上面我们将数据降维到2维, 接着我们将其进行可视化, 可以更加清楚的进行展示.
fig = plt.figure(figsize = (8,8))
ax = fig.add_subplot(1,1,1)
ax.set_xlabel('Principal Component 1', fontsize = 15)
ax.set_ylabel('Principal Component 2', fontsize = 15)
ax.set_title('2 Component PCA', fontsize = 20)
targets = ['Iris-setosa', 'Iris-versicolor', 'Iris-virginica']
colors = ['r', 'g', 'b']
for target, color in zip(targets,colors):
indicesToKeep = finalDf['target'] == target
ax.scatter(finalDf.loc[indicesToKeep, 'principal component 1']
, finalDf.loc[indicesToKeep, 'principal component 2']
, c = color
, s = 50)
ax.legend(targets)
ax.grid()