在vue项目中使用ECharts
ECharts官网
echarts社区
1.使用npm 安装 ECharts
npm install echarts --save
2. 在main.js中引入,并挂载到vue的prototype上
import Vue from 'vue'
import App from './App.vue'
import echarts from 'echarts'
Vue.prototype.$echarts=echarts
Vue.config.productionTip = false
new Vue({
render: h => h(App),
}).$mount('#app')
3. 在.vue文件中使用:
3.1 使用柱状图:
<template>
<div id="app">
<div id='main' class="mainBox"></div>
</div>
</template>
<script>
export default {
data() {
return {
};
},
methods: {
init() {
var myChart = this.$echarts.init(document.getElementById("main"));
myChart.setOption({
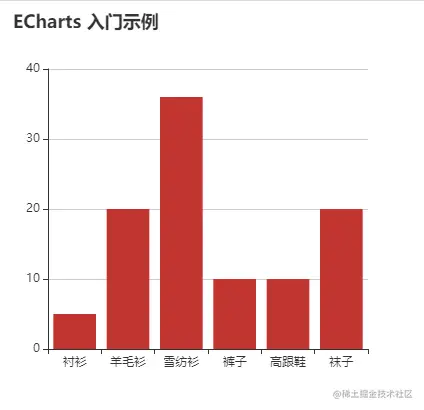
title: {
text: "ECharts 入门示例",
},
tooltip: {},
xAxis: {
data: ["衬衫", "羊毛衫", "雪纺衫", "裤子", "高跟鞋", "袜子"],
},
yAxis: {},
series: [
{
name: "销量",
type: "bar",
data: [5, 20, 36, 10, 10, 20],
},
],
});
},
},
mounted(){
this.init()
}
};
</script>
<style>
.mainBox{
width: 400px;
height: 400px;
}
</style>
4. 效果: