61 提取后缀名
>>> import os
>>> os.path.splitext('D:/source/dataset/new_file.txt')
('D:/source/dataset/new_file', '.txt') #[1]:后缀名
62 提取完整文件名
>>> import os
>>> os.path.split('D:/source/dataset/new_file.txt')
('D:/source/dataset', 'new_file.txt')
二、 Python 核心 12 例
63 斐波那契数列前n项
>>> def fibonacci(n):
      a, b = 1, 1
      for _ in range(n):
        yield a
        a, b = b, a+b # 注意这种赋值

>>> for fib in fibonacci(10):
      print(fib)

1
1
2
3
5
8
13
21
34
55
64 list 等分 n 组
>>> from math import ceil
>>> def divide_iter(lst, n):
      if n <= 0:
        yield lst
        return
      i, div = 0, ceil(len(lst) / n)
      while i < n:
        yield lst[i * div: (i + 1) * div]
        i += 1

>>> for group in divide_iter([1,2,3,4,5],2):
      print(group)

[1, 2, 3]
[4, 5]
65 yield 解释
有好几位同学问我,生成器到底该怎么理解。
在这里我总结几句话,看看是否对不理解生成器的朋友有帮助。
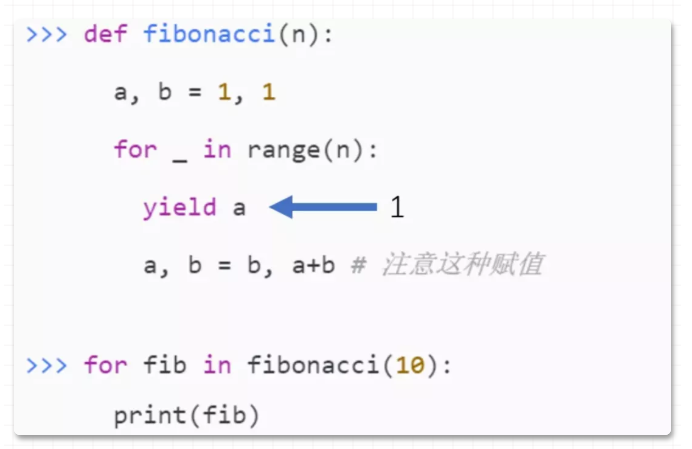
生成器首先是一个 “特殊的” return ,遇到 yield 立即中断返回。
但是,又与 return 不同,yield 后下一次执行会进入到yield 的下一句代码,而不像 return 下一次执行还是从函数体的第一句开始执行。
可能还是没说清,那就用图解释一下:
第一次 yield 返回 1
第二次迭代,直接到位置 2 这句代码:
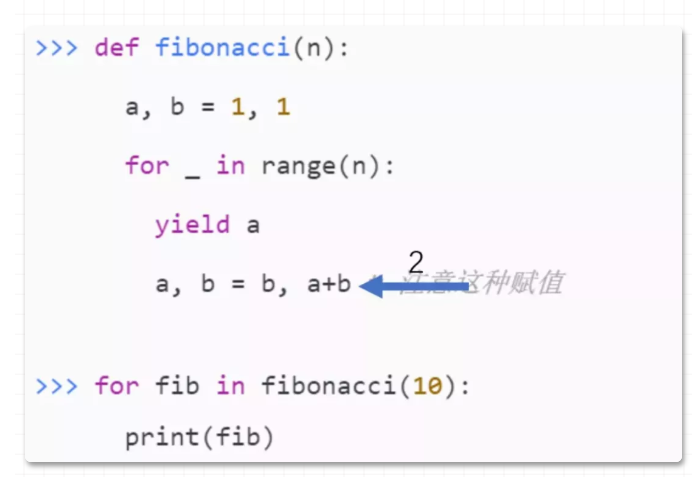
然后再走 for ,再 yield ,重复下去,直到for结束。
以上就是理解 yield 的重点一个方面。
66 装饰器
66.1 定义装饰器
time 模块大家比较清楚,第一个导入 wraps 函数(装饰器)为确保被装饰的函数名称等属性不发生改变用的,这点现在不清楚也问题不大,实践一下就知道了。
from functools import wraps
import time
定义一个装饰器:print_info,装饰器函数入参要求为函数,返回值要求也为函数。
如下,入参为函数 f, 返回参数 info 也为函数,满足要求。
def print_info(f):
    """
    @para: f, 入参函数名称
    """
    @wraps(f) # 确保函数f名称等属性不发生改变
    def info():
        print('正在调用函数名称为: %s ' % (f.__name__,))
        t1 = time.time()
        f()
        t2 = time.time()
        delta = (t2 - t1)
        print('%s 函数执行时长为:%f s' % (f.__name__,delta))

    return info
66.2使用装饰器
使用 print_info 装饰器,分别修饰 f1, f2 函数。
软件工程要求尽量一次定义,多次被复用。
@print_info
def f1():
    time.sleep(1.0)

@print_info
def f2():
    time.sleep(2.0)
66.3 使用装饰后的函数
使用 f1, f2 函数:
f1()
f2()

# 输出信息如下:

# 正在调用函数名称为:f1
# f1 函数执行时长为:1.000000 s
# 正在调用函数名称为:f2
# f2 函数执行时长为:2.000000 s
67 迭代器案例
一个类如何成为迭代器类型,请看官方PEP说明:
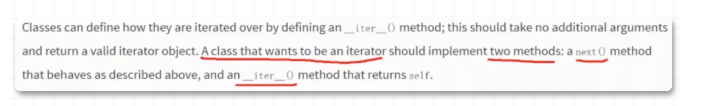
即必须实现两个方法(或者叫两种协议):__iter__ , __next__
下面编写一个迭代器类:
class YourRange():
    def __init__(self, start, end):
        self.value = start
        self.end = end

    # 成为迭代器类型的关键协议
    def __iter__(self):
        return self

    # 当前迭代器状态(位置)的下一个位置
    def __next__(self):
        if self.value >= self.end:
            raise StopIteration

        cur = self.value
        self.value += 1
        return cur
使用这个迭代器:
yr = YourRange(5, 12)
for e in yr:
    print(e)
迭代器实现__iter__ 协议,它就能在 for 上迭代,参考官网PEP解释: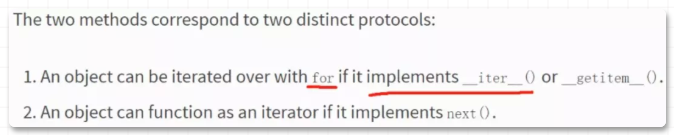
文章最后提个问题,如果此时运行:
next(yr)
会输出 5, 还是报错?
如果 yr 是 list,for 遍历后,再 next(iter(yr)) 又会输出什么?
如果能分清这些问题,恭喜你,已经真正理解迭代器迭代和容器遍历的区别。如果你还拿不准,欢迎交流。
下面使用 4 种常见的绘图库绘制柱状图和折线图,使用尽可能最少的代码绘制,快速入门这些库是本文的写作目的。
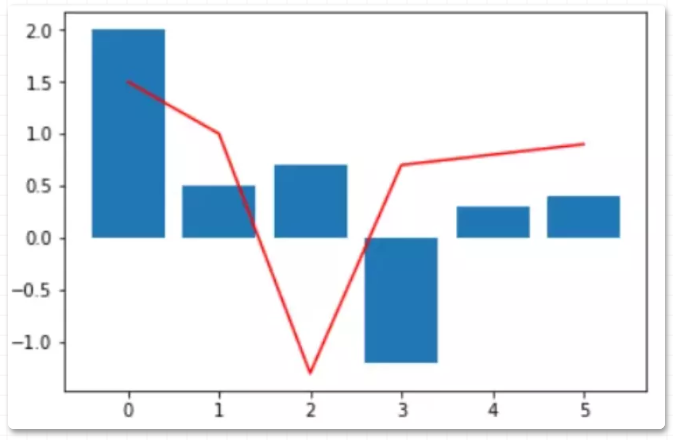
68 matplotlib
导入包:
import matplotlib
matplotlib.__version__  # '2.2.2'

import matplotlib.pyplot as plt
绘图代码:
import matplotlib.pyplot as plt
plt.plot([0, 1, 2, 3, 4, 5],
        [1.5, 1, -1.3, 0.7, 0.8, 0.9]
        ,c='red')
plt.bar([0, 1, 2, 3, 4, 5],
        [2, 0.5, 0.7, -1.2, 0.3, 0.4]
        )
plt.show()
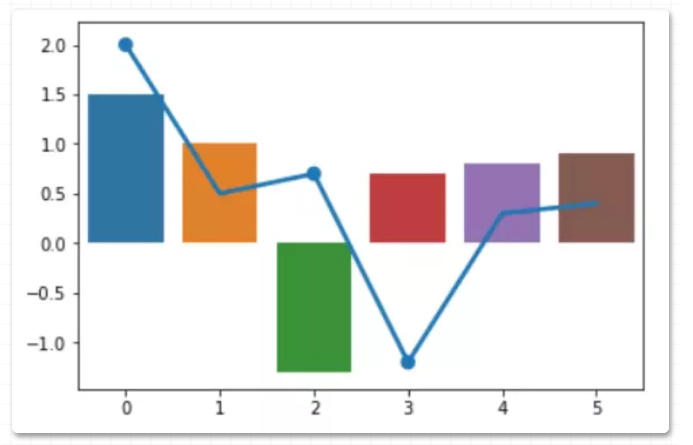
69 seaborn
导入包:
import seaborn as sns
sns.__version__ # '0.8.0'
绘制图:
sns.barplot([0, 1, 2, 3, 4, 5],
        [1.5, 1, -1.3, 0.7, 0.8, 0.9]
        )
sns.pointplot([0, 1, 2, 3, 4, 5],
        [2, 0.5, 0.7, -1.2, 0.3, 0.4]
        )
plt.show()
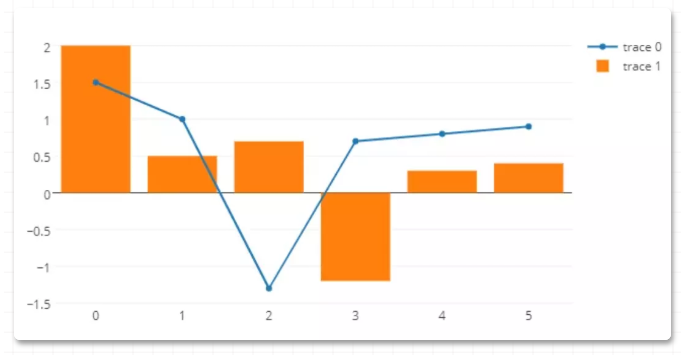
70 plotly 绘图
导入包:
import plotly
plotly.__version__ # '2.0.11'
绘制图(自动打开html):
import plotly.graph_objs as go
import plotly.offline as offline

pyplt = offline.plot
sca = go.Scatter(x=[0, 1, 2, 3, 4, 5],
             y=[1.5, 1, -1.3, 0.7, 0.8, 0.9]
            )
bar = go.Bar(x=[0, 1, 2, 3, 4, 5],
            y=[2, 0.5, 0.7, -1.2, 0.3, 0.4]
            )
fig = go.Figure(data = [sca,bar])
pyplt(fig)
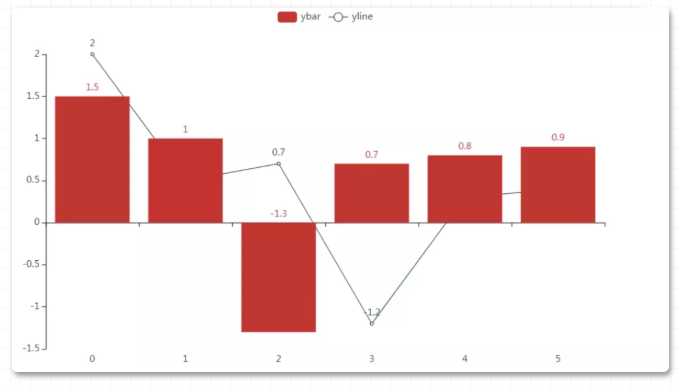
71 pyecharts
导入包:
import pyecharts
pyecharts.__version__ # '1.7.1'
绘制图(自动打开html):
bar = (
        Bar()
        .add_xaxis([0, 1, 2, 3, 4, 5])
        .add_yaxis('ybar',[1.5, 1, -1.3, 0.7, 0.8, 0.9])
    )
line = (Line()
        .add_xaxis([0, 1, 2, 3, 4, 5])
        .add_yaxis('yline',[2, 0.5, 0.7, -1.2, 0.3, 0.4])
        )
bar.overlap(line)
bar.render_notebook()
大家在复现代码时,需要注意API与包的版本紧密相关,与上面版本不同的包其内的API可能与以上写法有略有差异,大家根据情况自行调整即可。
matplotlib 绘制三维 3D 图形的方法,主要锁定在绘制 3D 曲面图和等高线图。
72 理解 meshgrid
要想掌握 3D 曲面图,需要首先理解 meshgrid 函数。
导入包:
import numpy as np
import matplotlib.pyplot as plt
创建一维数组 x
nx, ny = (5, 3)
x = np.linspace(0, 1, nx)
x
# 结果
# array([0\.  , 0.25, 0.5 , 0.75, 1\.  ])
创建一维数组 y
y = np.linspace(0, 1, ny)
y
# 结果
# array([0\. , 0.5, 1\. ])
使用 meshgrid 生成网格点:
xv, yv = np.meshgrid(x, y)
xv
xv 结果:
array([[0.  , 0.25, 0.5 , 0.75, 1.  ],
       [0.  , 0.25, 0.5 , 0.75, 1.  ],
       [0.  , 0.25, 0.5 , 0.75, 1.  ]])
yv 结果:
array([[0. , 0. , 0. , 0. , 0. ],
       [0.5, 0.5, 0.5, 0.5, 0.5],
       [1. , 1. , 1. , 1. , 1. ]])
绘制网格点:
plt.scatter(xv.flatten(),yv.flatten(),c='red')
plt.xticks(ticks=x)
plt.yticks(ticks=y)
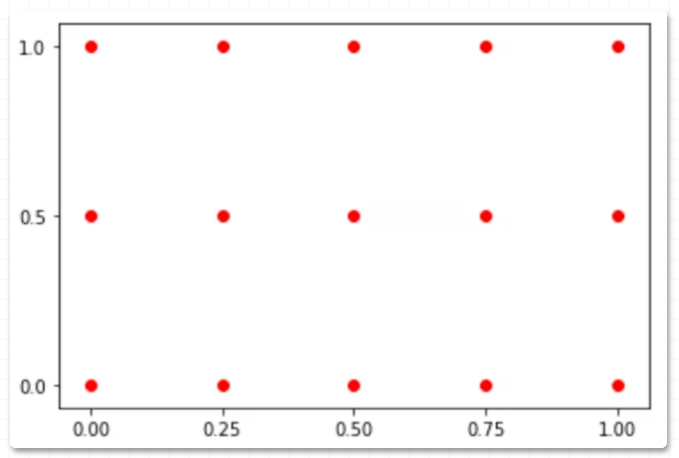
以上就是 meshgrid 功能:创建网格点,它是绘制 3D 曲面图的必用方法之一。
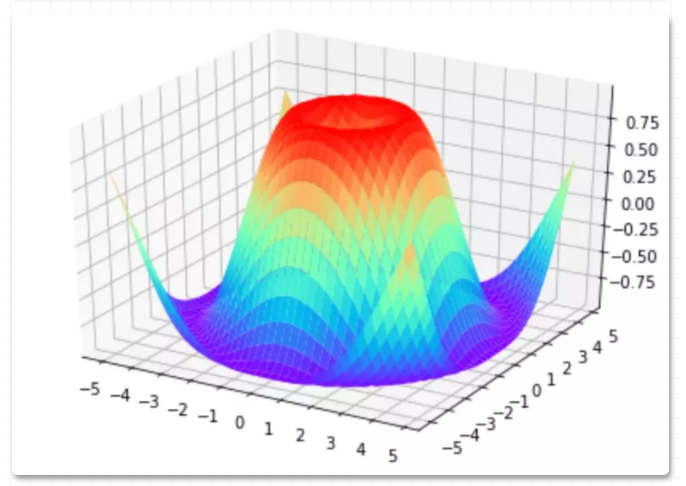
73 绘制曲面图
导入 3D 绘图模块:
from mpl_toolkits.mplot3d import Axes3D
生成X,Y,Z
# X, Y
x = np.arange(-5, 5, 0.25)
y = np.arange(-5, 5, 0.25)
X, Y = np.meshgrid(x, y)    # x-y 平面的网格
R = np.sqrt(X ** 2 + Y ** 2)
# Z
Z = np.sin(R)
绘制 3D 曲面图:
fig = plt.figure()
ax = Axes3D(fig)
plt.xticks(ticks=np.arange(-5,6))
plt.yticks(ticks=np.arange(-5,6))
ax.plot_surface(X, Y, Z, cmap=plt.get_cmap('rainbow'))
plt.show()
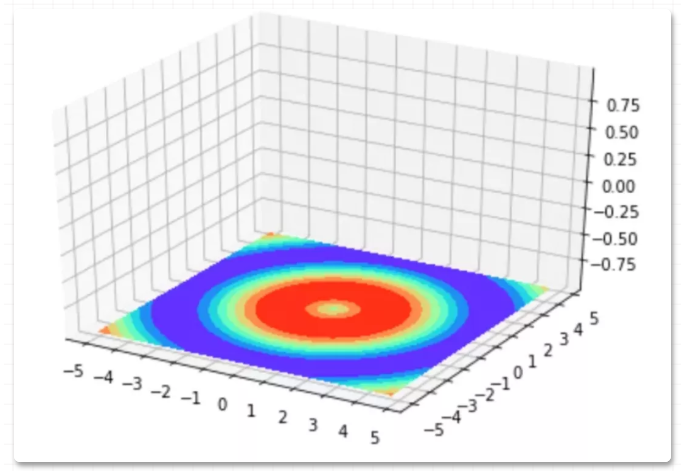
74 等高线图
以上 3D 曲面图的在 xy平面、 xz平面、yz平面投影,即是等高线图。
xy 平面投影得到的等高线图:
fig = plt.figure()
ax = Axes3D(fig)
plt.xticks(ticks=np.arange(-5,6))
plt.yticks(ticks=np.arange(-5,6))
ax.contourf(X, Y, Z, zdir='z', offset=-1, cmap=plt.get_cmap('rainbow'))
plt.show()