<div id="echart" class="echart-content"></div>
// 创建图表
Highcharts.chart('echart', {
title: {
text: ''
},
chart: {
type: 'column',
styledMode: false
},
xAxis: [
{
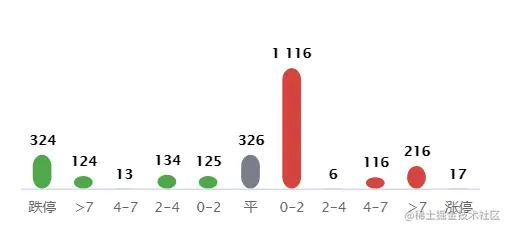
categories: ['跌停', '>7', '4-7', '2-4', '0-2', '平', '0-2', '2-4', '4-7', '>7', '涨停']
}
],
legend: {
enabled: false
},
exporting: {
enabled: false
},
yAxis: [{
opposite: true,
visible: false,
title: {
text: ''
}
}],
plotOptions: {
column: {
borderRadius: 10,
maxPointWidth: 16,
dataLabels: {
enabled: true
}
}
},
credits: {
enabled: false
},
series: [{
data: [{'color': '#50A74B', 'y': 324},
{'color': '#50A74B', 'y': 124},
{'color': '#50A74B', 'y': 13},
{'color': '#50A74B', 'y': 134},
{'color': '#50A74B', 'y': 125},
{'color': '#7B7F8B', 'y': 326},
{'color': '#D4453E', 'y': 1116},
{'color': '#D4453E', 'y': 6},
{'color': '#D4453E', 'y': 116},
{'color': '#D4453E', 'y': 216},
{'color': '#D4453E', 'y': 17}],
}]
});


