

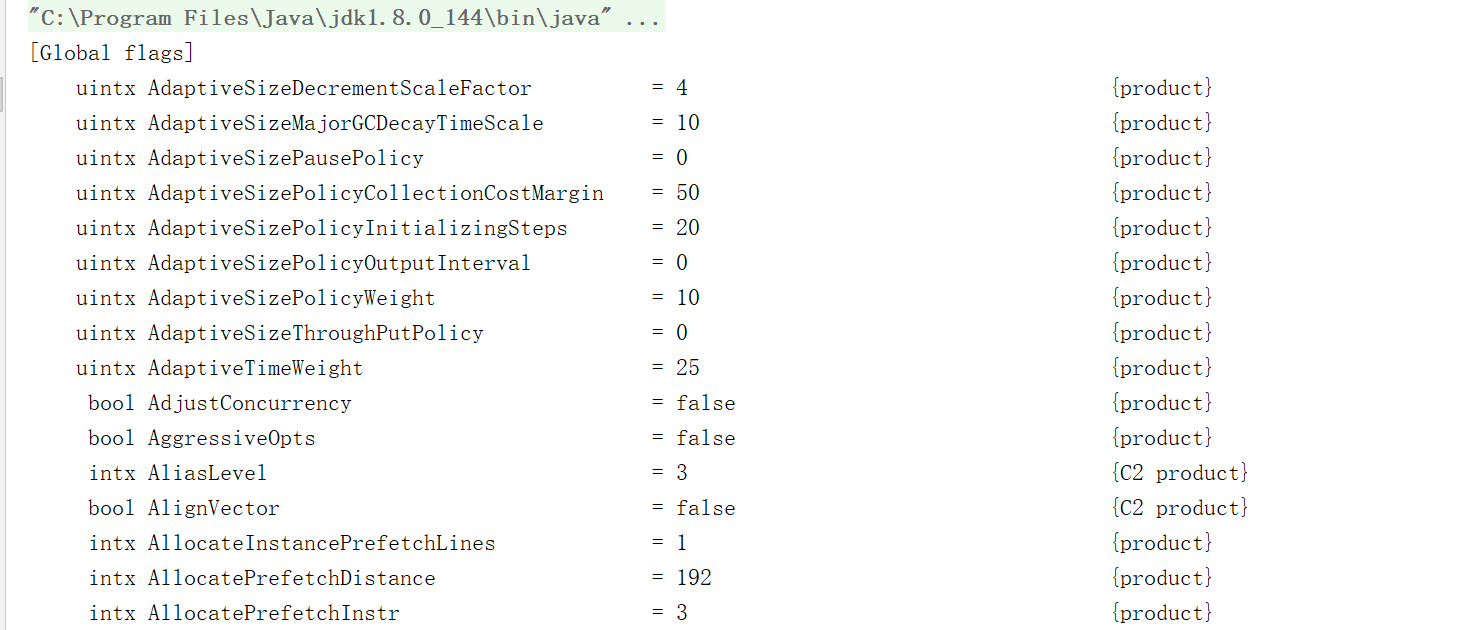
1 参数格式
例:-XX:PrintFlagsFinal参数可以输出所有参数的名称和其对应的值
2 设置方式
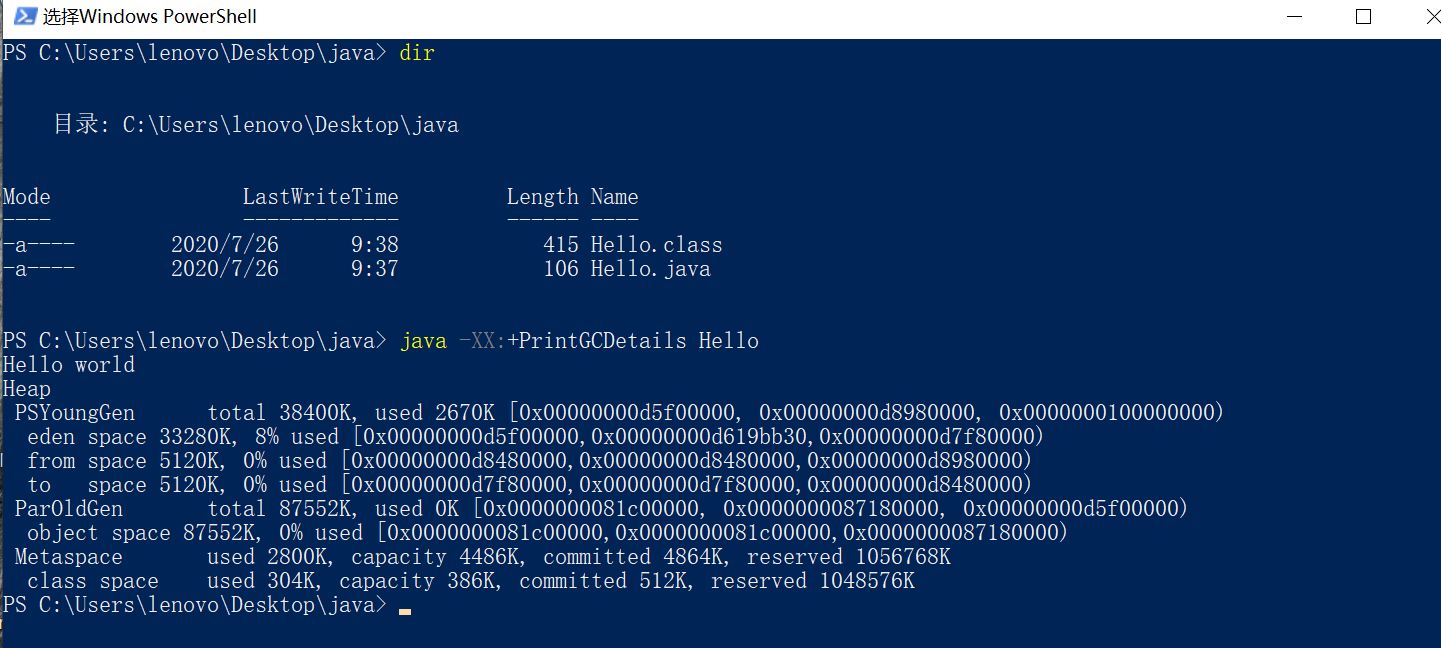
2.1 使用Java命令时设置参数
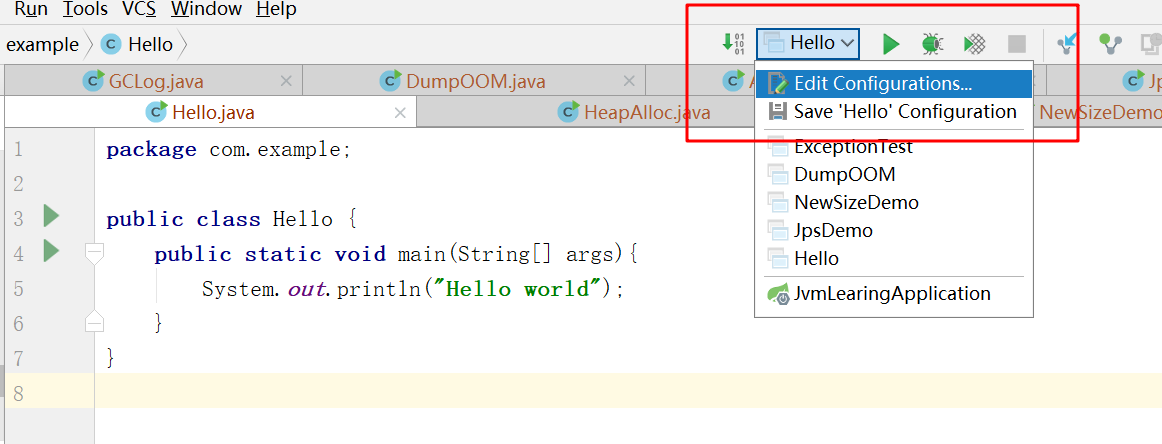
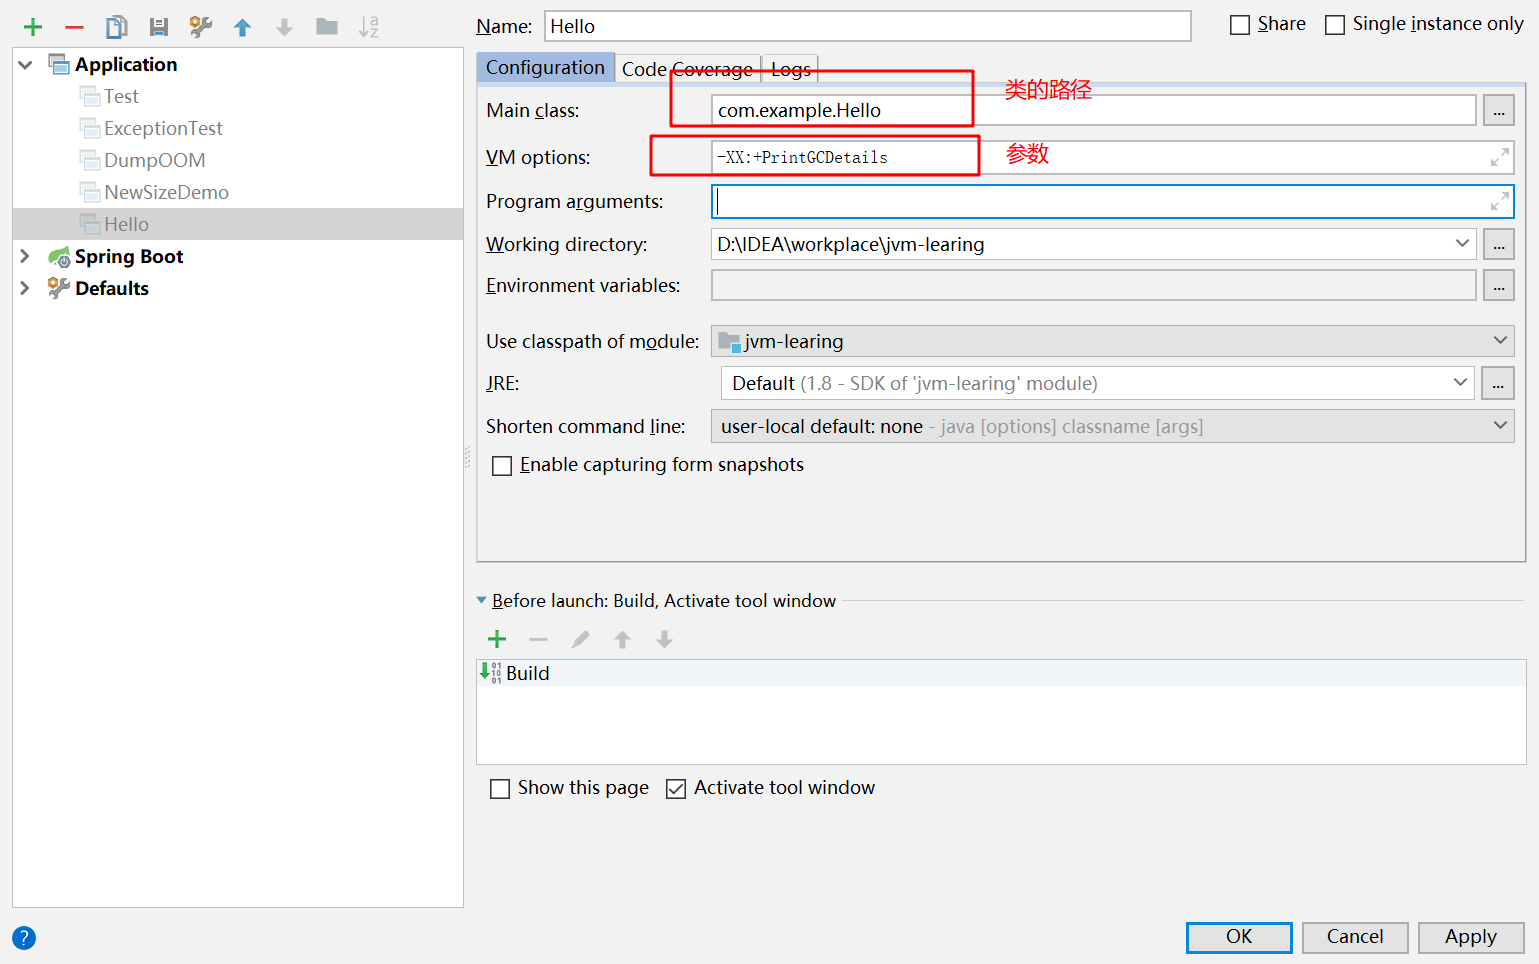
2.2 在IDEA中设置参数
2.3 Windows下的Tomcat
在tomcat的安装目录下的 bin/catalina.bat 添加下面这段参数
set "JAVA_OPTS=%JAVA_OPTS% -XX:+PrintGCDetails"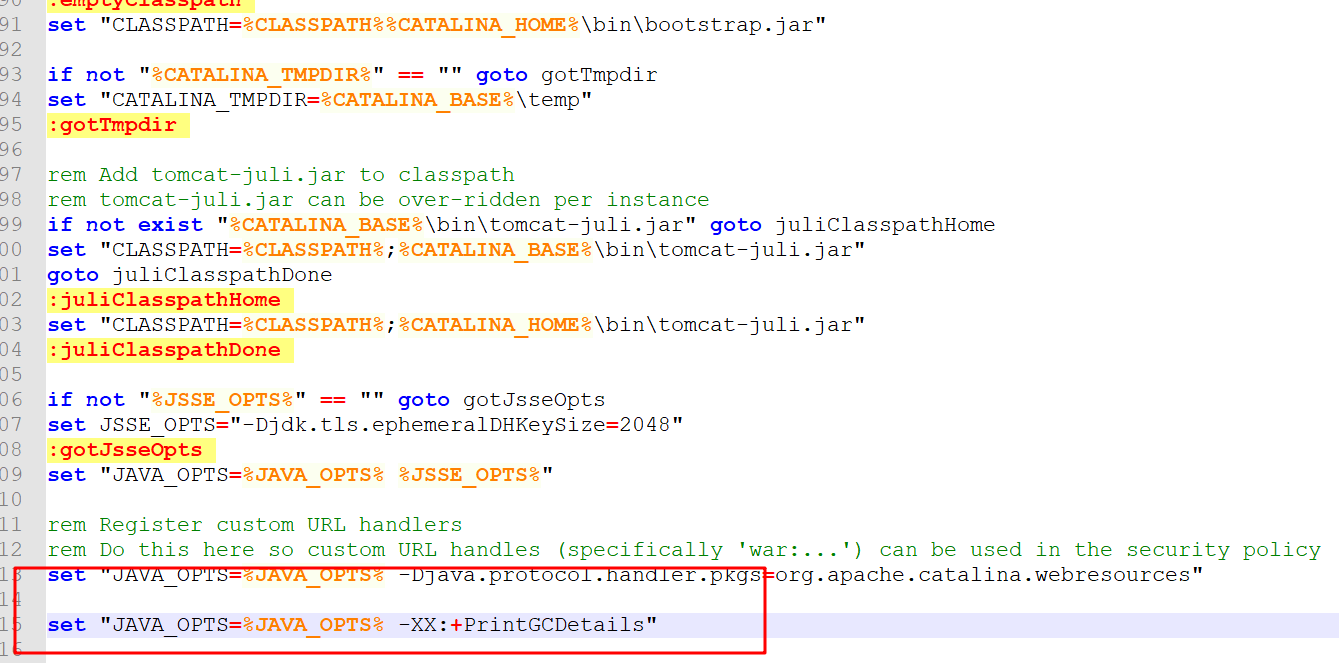
2.4 Linux下的Tomcat
在tomcat的安装目录下的 bin/catalina.sh 添加下面这段参数
JAVA_OPTS="$JAVA_OPTS -XX:+PrintGCDetails"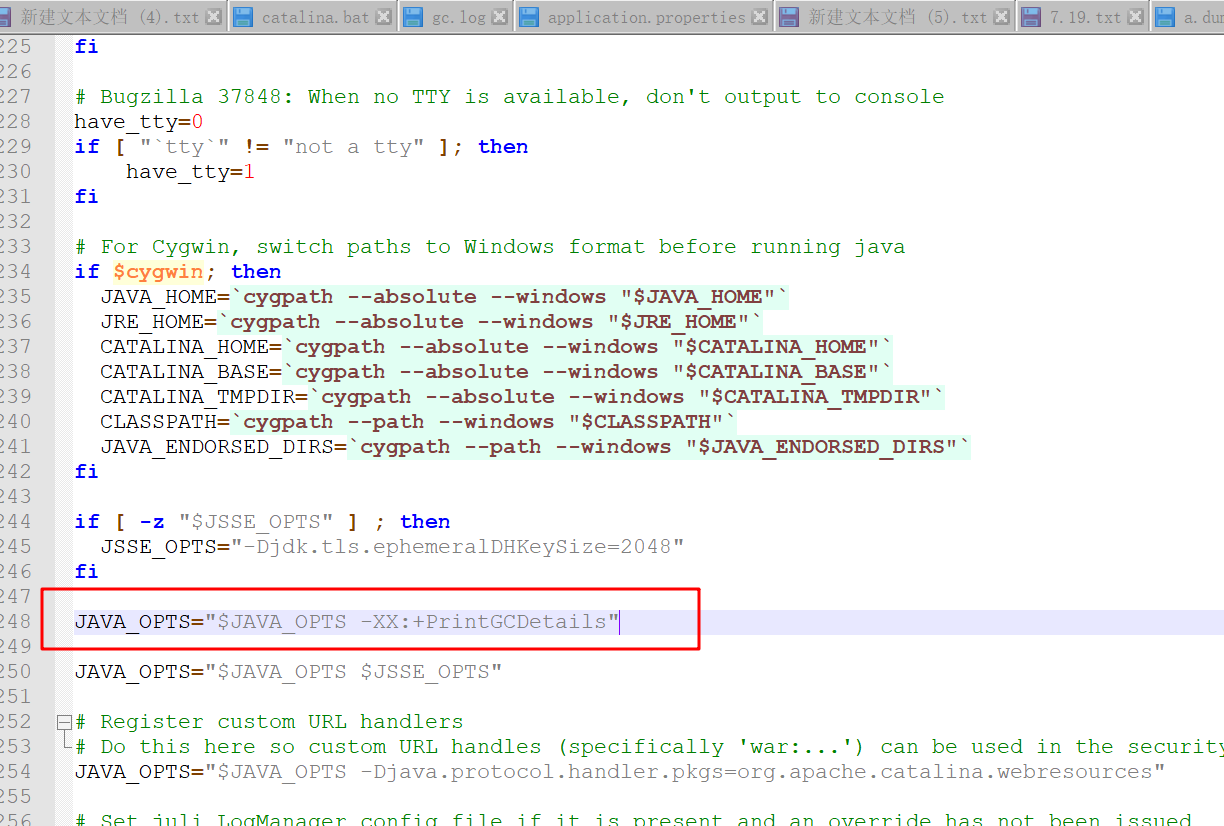
3 常用参数
3.1 日志参数及日志文件格式
遇到GC时就会打印日志,下面这条日志显示:内存分配失败,触发GC,GC前堆占用5632K,
GC后堆占用的内存为1353K,堆的总大小为19968K,垃圾回收消耗的时间为0,0030708秒
[GC (Allocation Failure) 5632K->1353K(19968K), 0.0030708 secs]该参数会打印更加详细的GC日志,下面这条日志显示:内存分配失败,年轻代GC前占内存为
用5632K,GC后年轻代占用的内存为504K,年轻代的总大小为6144K。GC前堆占用5632K,
GC后堆占用的内存为1355K,堆的总大小为19968K,垃圾回收消耗的时间为0.0028721秒。
user代表用户态CPU耗时,sys表示系统CPU耗时,real表示GC实际经历时间。
[GC (Allocation Failure) [PSYoungGen: 5632K->504K(6144K)] 5632K->1355K(19968K), 0.0028721 secs] [Times: user=0.00 sys=0.00, real=0.00 secs]
Heap上界和最大上界
[0x00000000ff980000, 0x0000000100000000, 0x0000000100000000)以新生代为例,总的可用大小为6144K,已经使用了3583K,当前上界与最大上界一致,
(0x0000000100000000 - 0x00000000ff980000)/ 1024 = 6656K(当前上界减下界的值
是16进制,除以1024前需要转换成十进制), 6656 = 5632(eden)+ 512(from) +
to(512),6144(可用大小) = 5632(eden) + 512(to 或者 from)
[GC (Allocation Failure) [PSYoungGen: 5632K->504K(6144K)] 5632K->1355K(19968K), 0.0028721 secs] [Times: user=0.00 sys=0.00, real=0.00 secs]
Heap
 PSYoungGen      total 6144K, used 3538K [0x00000000ff980000, 0x0000000100000000, 0x0000000100000000)
  eden space 5632K, 53% used [0x00000000ff980000,0x00000000ffc768e8,0x00000000fff00000)
  from space 512K, 98% used [0x00000000fff00000,0x00000000fff7e010,0x00000000fff80000)
  to   space 512K, 0% used [0x00000000fff80000,0x00000000fff80000,0x0000000100000000)
 ParOldGen       total 13824K, used 851K [0x00000000fec00000, 0x00000000ff980000, 0x00000000ff980000)
  object space 13824K, 6% used [0x00000000fec00000,0x00000000fecd4db8,0x00000000ff980000)
 Metaspace       used 5178K, capacity 5308K, committed 5504K, reserved 1056768K
  class space    used 571K, capacity 596K, committed 640K, reserved 1048576K
3.1.3 -XX:+PrintHeapAtGC
{Heap before GC invocations=1 (full 0):
 PSYoungGen      total 1536K, used 1024K [0x00000000ffe00000, 0x0000000100000000, 0x0000000100000000)
  eden space 1024K, 100% used [0x00000000ffe00000,0x00000000fff00000,0x00000000fff00000)
  from space 512K, 0% used [0x00000000fff80000,0x00000000fff80000,0x0000000100000000)
  to   space 512K, 0% used [0x00000000fff00000,0x00000000fff00000,0x00000000fff80000)
 ParOldGen       total 4096K, used 0K [0x00000000ffa00000, 0x00000000ffe00000, 0x00000000ffe00000)
  object space 4096K, 0% used [0x00000000ffa00000,0x00000000ffa00000,0x00000000ffe00000)
 Metaspace       used 2506K, capacity 4480K, committed 4480K, reserved 1056768K
  class space    used 273K, capacity 384K, committed 384K, reserved 1048576K
Heap after GC invocations=1 (full 0):
 PSYoungGen      total 1536K, used 504K [0x00000000ffe00000, 0x0000000100000000, 0x0000000100000000)
  eden space 1024K, 0% used [0x00000000ffe00000,0x00000000ffe00000,0x00000000fff00000)
  from space 512K, 98% used [0x00000000fff00000,0x00000000fff7e010,0x00000000fff80000)
  to   space 512K, 0% used [0x00000000fff80000,0x00000000fff80000,0x0000000100000000)
 ParOldGen       total 4096K, used 152K [0x00000000ffa00000, 0x00000000ffe00000, 0x00000000ffe00000)
  object space 4096K, 3% used [0x00000000ffa00000,0x00000000ffa26000,0x00000000ffe00000)
 Metaspace       used 2506K, capacity 4480K, committed 4480K, reserved 1056768K
  class space    used 273K, capacity 384K, committed 384K, reserved 1048576K
}
3.1.4 -XX:+PrintGCTimeStamps
移量(配合参数-XX:+PrintGC 打印的日志如下)
0.259: [GC (Allocation Failure)  1024K->624K(5632K), 0.0011621 secs]
0.342: [GC (Allocation Failure)  1641K->886K(5632K), 0.0010741 secs]
0.437: [GC (Allocation Failure)  1910K->1054K(5632K), 0.0016093 secs]
0.460: [GC (Allocation Failure)  2078K->1233K(5632K), 0.0013565 secs]
0.537: [GC (Allocation Failure)  2257K->1369K(5632K), 0.0017671 secs]
0.630: [GC (Allocation Failure)  2393K->1689K(5632K), 0.0016126 secs]
3.1.5 -XX:+PrintGCApplicationConcurrentTime
[GC (Allocation Failure)  1024K->648K(5632K), 0.0039906 secs]
Application time: 0.1075411 seconds
[GC (Allocation Failure)  1665K->875K(5632K), 0.0011048 secs]
Application time: 0.0545320 seconds
Application time: 0.0055058 seconds
[GC (Allocation Failure)  1899K->1040K(5632K), 0.0020741 secs]
Application time: 0.0244538 seconds
[GC (Allocation Failure)  2061K->1242K(5632K), 0.0010841 secs]
Application time: 0.0664599 seconds
[GC (Allocation Failure)  2266K->1369K(5632K), 0.0009083 secs]
Application time: 0.1090666 seconds
[GC (Allocation Failure)  2393K->1672K(5632K), 0.0022457 secs]
3.1.6 -XX:+PrintGCApplicationStoppedTime
的日志如下)
[GC (Allocation Failure)  1024K->624K(5632K), 0.0011547 secs]
Total time for which application threads were stopped: 0.0013519 seconds, Stopping threads took: 0.0000221 seconds
Application time: 0.2133466 seconds
[GC (Allocation Failure)  1641K->865K(5632K), 0.0317181 secs]
Total time for which application threads were stopped: 0.0319891 seconds, Stopping threads took: 0.0000199 seconds
Application time: 0.0781122 seconds
[GC (Allocation Failure)  1889K->1037K(5632K), 0.0032912 secs]
Total time for which application threads were stopped: 0.0034839 seconds, Stopping threads took: 0.0000376 seconds
Application time: 0.0275251 seconds
[GC (Allocation Failure)  2061K->1230K(5632K), 0.0027525 secs]
Total time for which application threads were stopped: 0.0029744 seconds, Stopping threads took: 0.0000397 seconds
Application time: 0.0928152 seconds
[GC (Allocation Failure)  2254K->1383K(5632K), 0.0010224 secs]
Total time for which application threads were stopped: 0.0011923 seconds, Stopping threads took: 0.0000309 seconds
Application time: 0.1532793 seconds
[GC (Allocation Failure)  2407K->1681K(5632K), 0.0035492 secs]
Total time for which application threads were stopped: 0.0037530 seconds, Stopping threads took: 0.0000416 seconds
将gc日志用文件的形式输出,该参数表示将gc日志写入到"D:/tmp/gc.log"中
3.2 堆
3.2.1 设置堆各个区域的大小堆
-Xmx:堆的最大值(如设置-Xmx10m表示堆的最大值为10m)
-Xms:堆的初始大小(如设置-Xms10m表示堆的初始大小为10m)
-Xmn:新生代大小(如设置-Xmn=10表示新生代大小为10m)
3.2.2 设置堆区域的比例
-XX:SurvivorRatio:eden/to  or eden/from(默认为8,如设置-XX:SurvivorRatio=8,表示eden和survivor的比例为8:1)
-XX:NewRatio=老年代/新生代(默认为2,如设置-XX:NewRatio=8,表示老年代和新生代的比例为8:1)
3.2.3 内存溢出常用参数
-XX:+HeapDumpOnOutOfMemoryError:内存溢出时,导出整个堆信息
-XX:HeapDumpPath:指定堆导出文件路径(-XX:+HeapDumpOnOutOfMemoryError -XX:HeapDumpPath=D:/tmp/a.dump,表示内存溢出,将堆的信息保存到"D:/tmp/a.dump"文件中)
-XX:OnOutOfMemoryError:发生内存溢出后可以指定一个脚本执行("-XX:OnOutOfMemoryError=C:/Users/lenovo/Desktop/printstack.bat %p" ,内存溢出后,执行printstack.bat脚本,注意双引号也是需要写的)
3.3 非堆
-XX:PermSize:初始永久区大小(如-XX:PermSize=10m,表示初始永久区大小为10m)
-XX:MaxPermSize:最大永久区大小(如-XX:MaxPermSize=10m,表示永久区最大大小为10m)
-XX:MaxMetaspaceSize:永久区的最大可用值(如-XX:MaxMetaspaceSize=10m,表示永久区最大可用值为10m)
3.4 栈
-Xss:指定线程栈的大小(如-Xss=1m,表示线程栈的大小为1m)3.5 直接内存
-XX:MaxDirectMemorySize:最大可用直接内存,默认与-Xmx一样(如-XX:MaxDirectMemorySize=10m,表示直接内存的最大可用值为10m)