matplotlib.gridspec.GridSpec(nrows, ncols, figure=None, left=None, bottom=
None, right=None, top=None, wspace=
None, hspace=None, width_ratios=None,
height_ratios=None)
这个方法的使用可以通过matplotlib.gridspec.GridSpec生成一个GridSpec对象,通过subplot使用GridSpec对象生成子图;也可以使用matplotlib.pyplot.add_gridspec()来生成GridSpec对象。参数的使用情况一样。
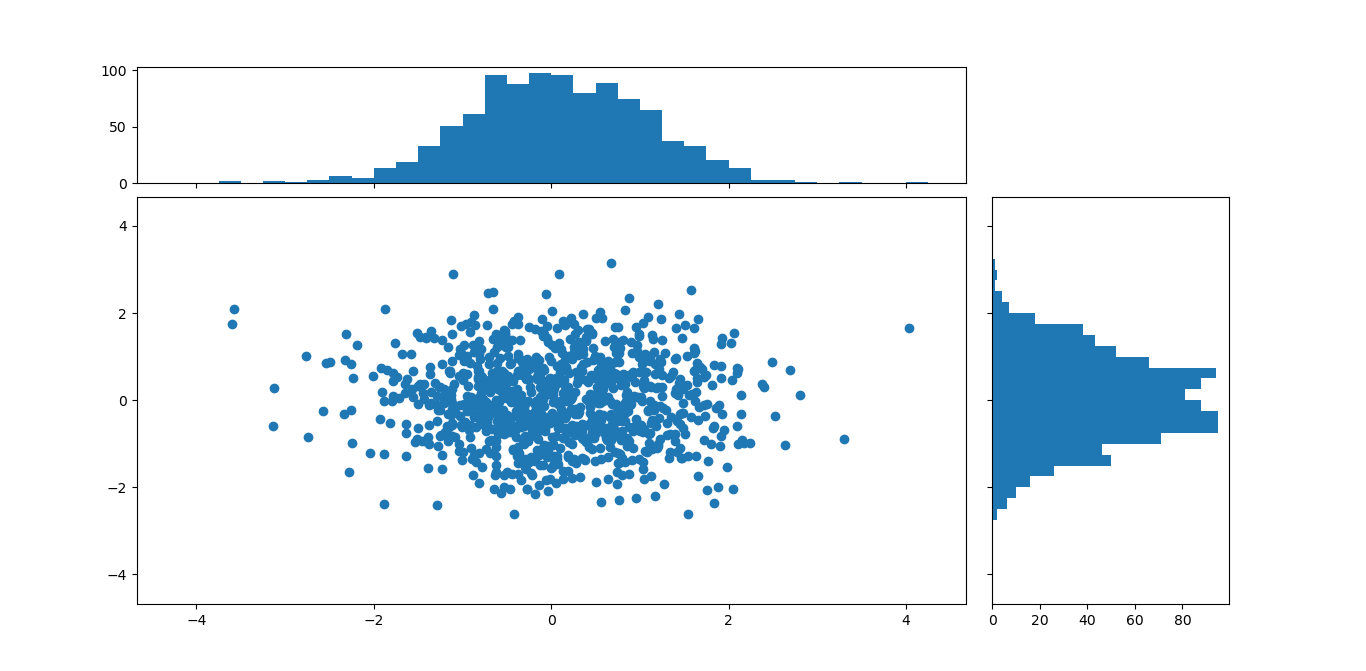
matplotlib.pyplot.add_gridspec()方法
import numpy as np
import matplotlib.pyplot as plt

# Fixing random state for reproducibility
np.random.seed(19680801)# some random data
x = np.random.randn(1000)
y = np.random.randn(1000)

def scatter_hist(x, y, ax, ax_histx, ax_histy):
# no labels
ax_histx.tick_params(axis="x", labelbottom=False)
ax_histy.tick_params(axis="y", labelleft=False)
# the scatter plot:
ax.scatter(x, y)

# now determine nice limits by hand:
binwidth = 0.25
xymax = max(np.max(np.abs(x)), np.max(np.abs(y)))
lim = (int(xymax/binwidth) + 1) * binwidth
bins = np.arange(-lim, lim + binwidth, binwidth)
ax_histx.hist(x, bins=bins)
ax_histy.hist(y, bins=bins, orientation='horizontal')


# start with a square Figure

fig = plt.figure(figsize=(8, 8))
# Add a gridspec with two rows and two columns and a ratio of 2 to 7 between# the size of the marginal axes and the main axes in both directions.
# Also adjust the subplot parameters for a square plot.
gs = fig.add_gridspec(2, 2,  width_ratios=(7, 2), height_ratios=(2, 7),
                      left=0.1, right=0.9, bottom=0.1, top=0.9,
                      wspace=0.05, hspace=0.05)
ax = fig.add_subplot(gs[1, 0])
ax_histx = fig.add_subplot(gs[0, 0], sharex=ax)
ax_histy = fig.add_subplot(gs[1, 1], sharey=ax)
# use the previously defined function

scatter_hist(x, y, ax, ax_histx, ax_histy)
a=gs.get_subplot_params()

plt.show()