promutheus 与nginx 对比
优势
- 安装简单
- 时序数据库,对于监控场景,以时间维度查询性能高
- 告警条件多样化
多维度数据模型。 灵活的查询语言。 不依赖分布式存储,单个服务器节点是自主的。 通过基于HTTP的pull方式采集时序数据。 可以通过中间网关进行时序列数据推送。 通过服务发现或者静态配置来发现目标服务对象。 支持多种多样的图表和界面展示,比如Grafana等。
promutheus概念与配置
时间序列:
- 指标名称
- 标签
- 时间戳
- 样本值
表达式:
<metric name>{<label name>=<label value>, ...}
例如:
api_http_requests_total{method="POST", handler="/messages"}
指标类型 计数器(counter),从开始监控,到指定时间点,单调递增,只增不减; 仪表盘(gauge),瞬时值,例如温度; 直方图(Histogram),按时间区间统计; 汇总(Summary)
docker 方式启动
docker run -p 9090:9090 -v /prometheus-data \
prom/prometheus --config.file=/prometheus-data/prometheus.yml
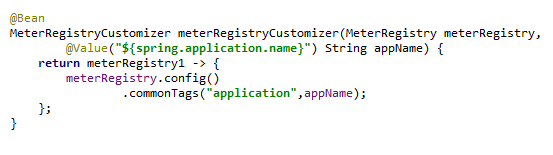
springboot项目暴露监控信息
让 springboot 输出 prometheus 支持的监控信息格式;
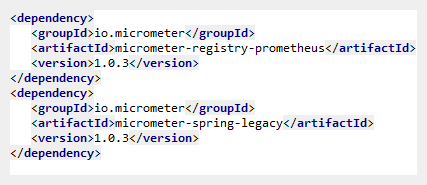
添加依赖:
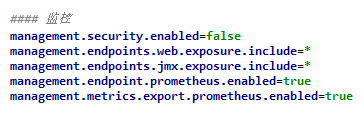
开启监控
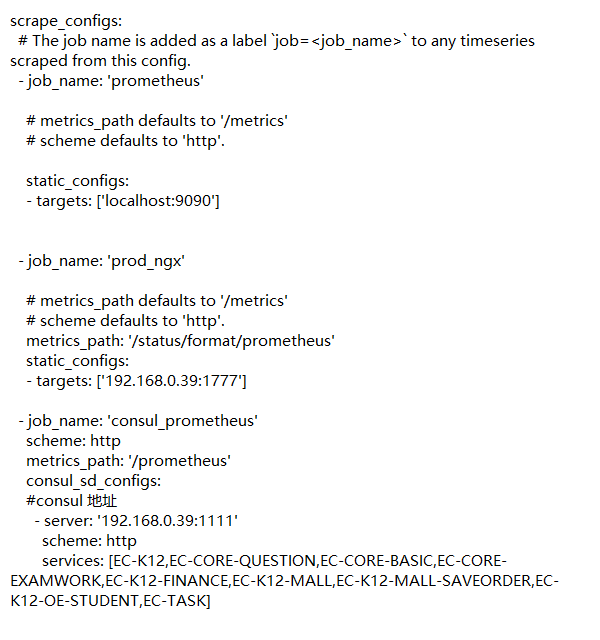
在promutheus 的配置文件 /etc/alertmanager/alertmanager.yml 中配置要监控的应用
scrape_configs:
  # The job name is added as a label `job=<job_name>` to any timeseries scraped from this config.
  - job_name: 'prometheus'

    # metrics_path defaults to '/metrics'
    # scheme defaults to 'http'.

    static_configs:
    - targets: ['localhost:9090']

  # The job name is added as a label `job=<job_name>` to any timeseries scraped from this config.
  - job_name: 'prod_k12'

    # metrics_path defaults to '/metrics'
    # scheme defaults to 'http'.
    metrics_path: '/prometheus'
    static_configs:
    - targets: ['ip:port']

  - job_name: 'prod_ngx'

    # metrics_path defaults to '/metrics'
    # scheme defaults to 'http'.
    metrics_path: '/status/format/prometheus'
    static_configs:
    - targets: ['ip:port']
promutheus 通过 eureka 动态发现服务并进行监控
在eureka server 中加入依赖
<!-- prometheus 服务发现用 -->
   	<dependency>
   		<groupId>at.twinformatics</groupId>
   		<artifactId>eureka-consul-adapter</artifactId>
   		<version>1.0.1</version>
   	</dependency>
配置 promutheus.yml
grafana配置
在官网 搜索 模板 Spring Boot Statistics 添加
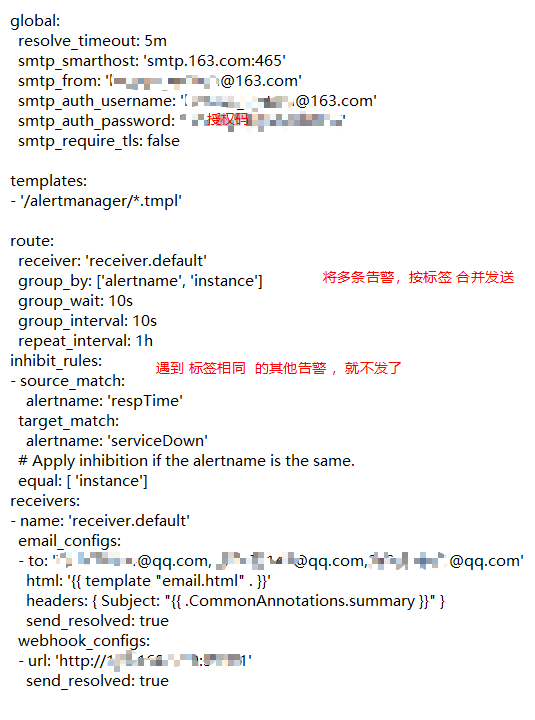
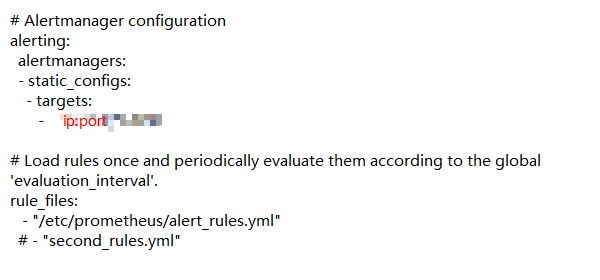
alertmanager 邮件告警配置
在 prometheus.yml 中加入告警配置
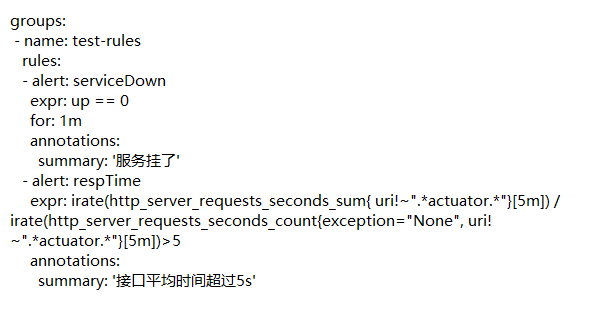
告警规则文件 alert_rules.yml 内容
alertmanager.yml 文件 内容: