Echarts 例子
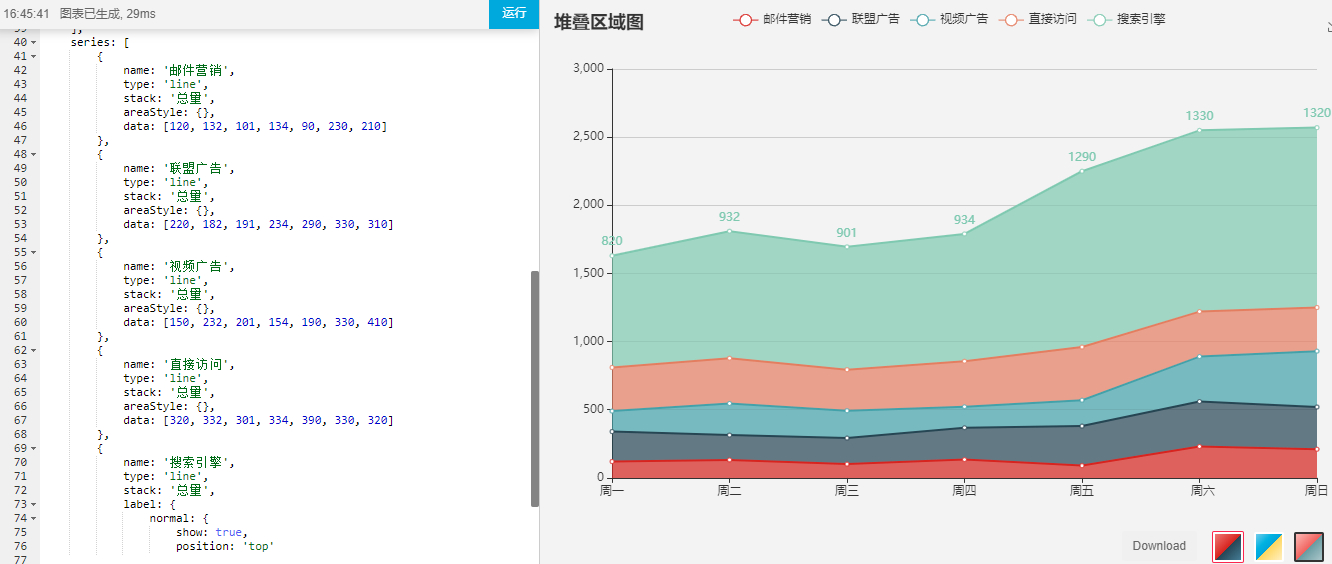
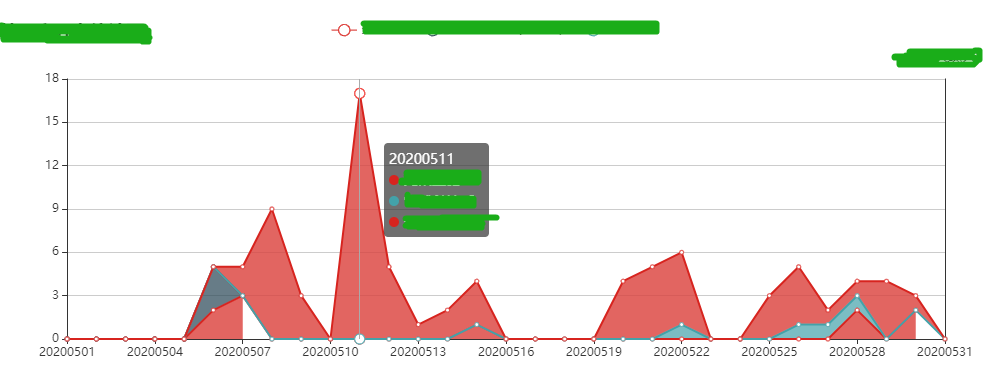
根据业务需要渲染堆叠折线图
<template>
    <div>
      <div id="myChart" style="width: 1000px;height:400px;"></div>
    </div>
</template>

export default {
  data() {
        return {
          servesData: [],
          issueDate: [],
          unitName: [],
        }
    },
  mounted() {
    this.drawLine();
  },
  methods: {
    drawLine(issueDate, servesData, unitName) {
      let myChart = this.$echarts.init(document.getElementById("myChart"));

      console.log(servesData, "折线图数据");
      let option = {
        title: {
          text: "堆叠折线图"
        },
        tooltip: {
          trigger: "axis" //图表提示框显示
        },
        legend: {
          data: unitName
        },
        grid: {
          //网格配置,可以控制线形图,柱状图,图标大小
          left: "5%",
          right: "5%",
          containLabel: true //y轴左侧刻度显示
        },
        xAxis: {
          type: "category",
          boundaryGap: false,
          data: issueDate
        },
        yAxis: [
          {
            type: "value",
            axisLabel: {
              formatter: "{value}"
            }
          },
          {
            name: "数量",
            nameLocation: "start",
            type: "value",
            inverse: true
          }
        ],
        series: servesData
      };
      myChart.setOption(option);

      window.onresize = function() {
        myChart.resize();
      };
    },

  // 折线图接口
  OpenCardView(
    page.currentPage,
    page.pageSize,
    Object.assign(params, this.query)
  ).then(res => {
    this.loading = false;
    this.selectionClear();
    const { records } = res.data.data;
    records.forEach(dataLine => {
      const { unitName, issueDate, total, unitNo } = dataLine;
      this.issueDate = issueDate;
      this.servesData.push({
        name: unitName,
        type: "line",
        stack: "总量",
        areaStyle: {},
        data: total
          });
        });
        this.drawLine(
          this.issueDate, //显示的时间
          this.servesData, //显示折线的数据
          this.servesData.unitName //legend 的 data
        );
      });
    }
}
效果图