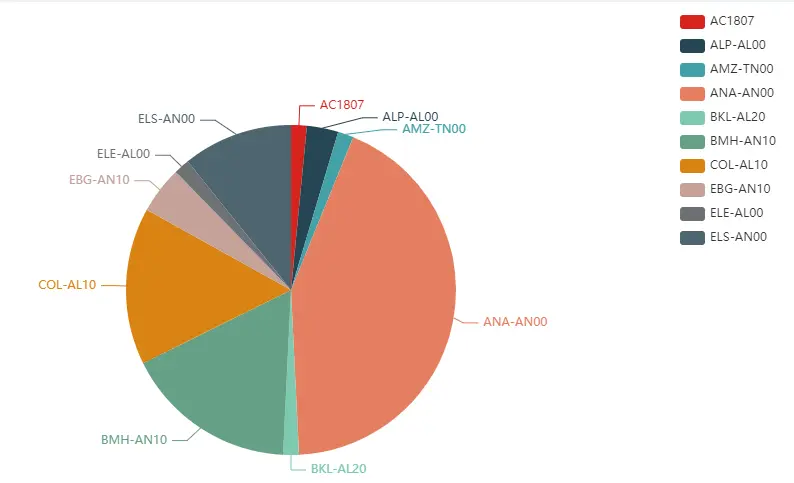
Echarts 的例子
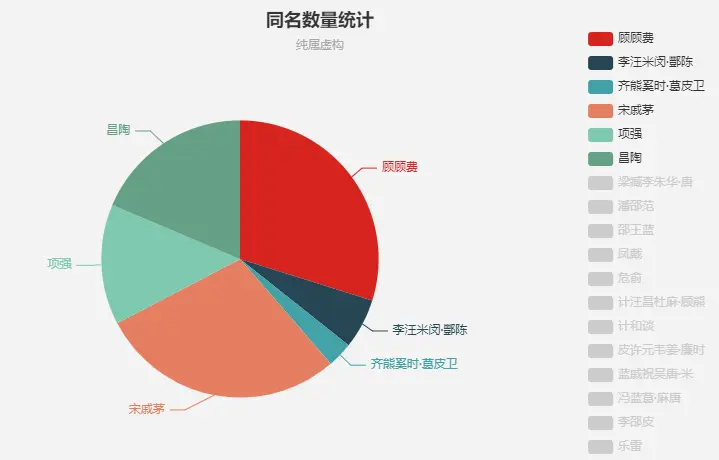
根据业务需要渲染饼状图
<template>
    <div>
      <div id="myChart" style="width: 1000px;height:600px;"></div>
    </div>
</template>

 data() {
    return {
      page: {
        pageSize: 10,
        currentPage: 1,
        total: 0
      },
    skyOpenCharts: [],
    }
}

 mounted() {
    this.drawLine();
  },
   methods: {
     drawLine(skyOpenCharts) {
      let myChart = this.$echarts.init(document.getElementById("myChart"));

      console.log(this.skyOpenCharts, "饼图数据");
      let BOX = [];
      let selected = [];
      let phoneType = [];
      let value = [];
      for (var k of this.skyOpenCharts) {
        phoneType.push(k.phoneType);
        value.push(k.count);
      }
      console.log(value, "value");
      console.log(phoneType, "phoneType");

      for (let i = 0; i < value.length; i++) {
        BOX.push({
          name: phoneType[i],
          value: value[i]
        });
        selected[name] = i < 6;
      }
      let option = {
        title: {
          text: "饼状统计图",
          left: "left"
        },
        tooltip: {
          trigger: "item",
          formatter: "{a} <br/>{b} : {c} ({d}%)"
        },
        legend: {
          type: "scroll",
          orient: "vertical",
          right: 10,
          top: 20,
          bottom: 20,
          data: phoneType
        },
        series: [
          {
            name: "数量",
            type: "pie",
            radius: "55%",
            center: ["50%", "50%"],
            data: BOX,
            emphasis: {
              itemStyle: {
                shadowBlur: 10,
                shadowOffsetX: 0,
                shadowColor: "rgba(0, 0, 0, 0.5)"
              }
            }
          }
        ]
      };
      myChart.setOption(option);
    },

    <!--接口-->
    onLoad(page, params = {}) {
      this.loading = true;
      getList(
        page.currentPage,
        page.pageSize,
        Object.assign(params, this.query)
      ).then(res => {
        this.skyOpenCharts = res.data.data.records;
        this.drawLine(this.skyOpenCharts);
      });
    },
   }