第一种
1.先npm安装echarts
npm install echarts --save
2. 在main.js中引入echarts
import myCharts from './comm/js/myCharts.js'
Vue.use(myCharts)
3.在创建一个myCharts.js文件
import echarts from 'echarts'
const install = function(Vue) {
Object.defineProperties(Vue.prototype, {
$chart: {
get() {
return {
//画一条简单的线
line1: function (id) {
this.chart = echarts.init(document.getElementById(id));
this.chart.clear();
const optionData = {
xAxis: {
type: 'category',
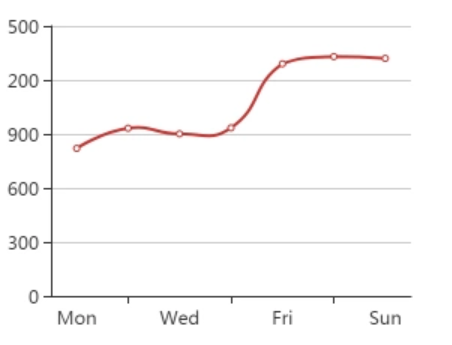
data: ['Mon', 'Tue', 'Wed', 'Thu', 'Fri', 'Sat', 'Sun']
},
yAxis: {
type: 'value'
},
series: [{
data: [820, 932, 901, 934, 1290, 1330, 1320],
type: 'line',
smooth: true
}]
};
this.chart.setOption(optionData);
},
}
}
}
})
}
export default {
install
}
4.在创建一个ECharts.vue文件
<template>
  <div class="hello">
    <div id="chart1"></div>
  </div>
</template>

<script>
export default {
  name: 'HelloWorld',
  data () {
    return {
    }
  },
  mounted() {
    this.$chart.line1('chart1');
  }
}
</script>

<style scoped>
  #chart1 {
    width: 300px;
    height: 300px;
  }
</style>
5.效果如下:
第二种
1.先npm安装echarts
npm install echarts --save
2. 在main.js中引入echarts
import myCharts from './comm/js/myCharts.js'
Vue.use(myCharts)
3.创建一个ECharts.vue文件
<template>
<div id="chartPie" class="pie-wrap"></div>
</template>
<script>
import * as echarts from 'echarts';
require('echarts/theme/macarons');//引入主题
export default {
data() {
return {
chartPie: null
}
},
mounted() {
this.$nextTick(() => {
this.drawPieChart();
})
},
methods: {
drawPieChart() {
let mytextStyle = {
color: "#333",
fontSize: 18,
};
let mylabel = {
show: true,
position: "right",
offset: [30, 40],
formatter: '{b} : {c} ({d}%)',
textStyle: mytextStyle
};
this.chartPie = echarts.init(document.getElementById('chartPie'),'macarons');
this.chartPie.setOption({
title: {
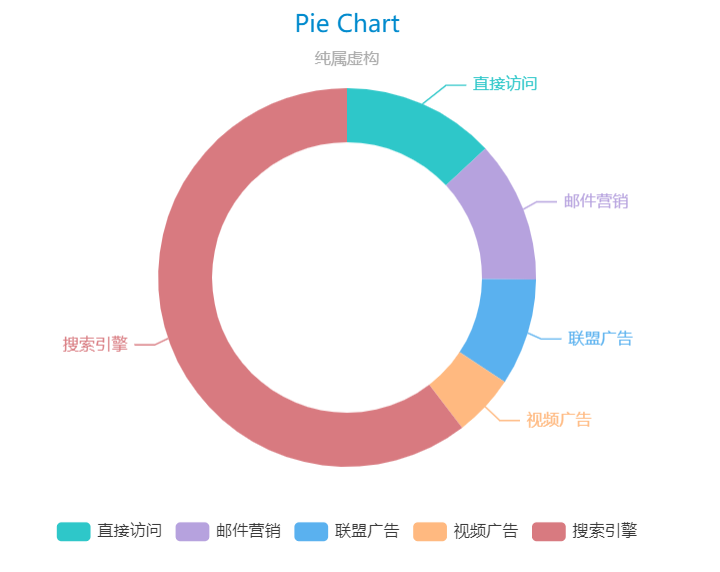
text: 'Pie Chart',
subtext: '纯属虚构',
x: 'center'
},
tooltip: {
trigger: 'item',
formatter: "{a} <br/>{b} : {c} ({d}%)",
},
legend: {
data: ['直接访问', '邮件营销', '联盟广告', '视频广告', '搜索引擎'],
left:"center",
top:"bottom",
orient:"horizontal",
},
series: [
{
name: '访问来源',
type: 'pie',
radius: ['50%', '70%'],
center: ['50%', '50%'],
data: [
{value: 335, name: '直接访问'},
{value: 310, name: '邮件营销'},
{value: 234, name: '联盟广告'},
{value: 135, name: '视频广告'},
{value: 1548, name: '搜索引擎'}
],
animationEasing: 'cubicInOut',
animationDuration: 2600,
label: {
emphasis: mylabel
}
}
]
});
}
}
}
</script>
<style lang='scss' scope>
.pie-wrap{
width:100%;
height:400px;
}
</style>
4.效果如下: