

前言
前段时间需要开发一个go项目,顺便调研了一下dlv的使用,参考了一些文章,在这里记录一下。
安装
使用
首先先使用dlv或dlv --help来查看delve支持的命令:
user$ dlv
Delve是Go程序的源代码级调试器.

Delve通过控制进程的执行、评估变量以及提供线程/ goroutine状态、CPU寄存器状态等信息,使你能够与程序进行交互。

这个工具的目标是为调试Go程序提供一个简单而强大的接口.

使用“--”将标志传递给正在调试的程序,例如:

`dlv exec ./hello -- server --config conf/config.toml`

Usage:
  dlv [command]

Available Commands:
  attach      连接到正在运行的流程并开始调试.
  connect     连接到无头调试服务器.
  core        检查核心转储.
  debug       编译并开始调试当前目录下的主包或指定的包.
  exec        执行预编译的二进制文件,并开始调试会话.
  help        帮助信息
  run         弃用的命令。使用“debug”替代它.
  test        编译测试二进制文件并开始调试程序.
  trace       编译并开始跟踪程序.
  version     打印版本.

Flags:
      --accept-multiclient   允许无头服务器接受多个客户机连接。注意,服务器API不是可重入的,客户端必须协调.
      --api-version int      无头时选择API版本. (default 1)
      --backend string       后端选择:
            default        在macOS上使用lldb,其他地方都是本地的.
            native        本地后端.
            lldb        使用lldb-server或debugserver.
            rr            使用mozilla rr (https://github.com/mozilla/rr).
         (default "default") 默认使用的是default
      --build-flags string   生成标志,以传递给编译器.
      --headless             仅在headless模式下运行调试服务器.
      --init string          初始化文件,由终端客户端执行.
  -l, --listen string        调试服务器监听地址. (default "localhost:0")
      --log                  启用调试服务器日志记录.
      --log-output string    应该产生调试输出的组件的逗号分隔列表,可能的值为:
            debugger    记录调试器命令
            gdbwire        日志连接到gdbserial后端
            lldbout        将输出从debugserver/lldb复制到标准输出
            debuglineerr    读取.debug_line时日志可恢复错误
            rpc            记录所有RPC消息
            fncall        日志函数调用协议
            minidump    日志minidump加载
            使用--log启用日志时,默认为“debugger”.
      --wd string            用于运行程序的工作目录. (default ".")

使用"dlv [command] --help"获取有关命令的详细信息.
支持的命令比较多,在这里我们主要介绍它的调试命令——debug
dlv debug
首先使用dlv debug --help 查看帮助信息:
user$ dlv debug --help
编译禁用优化的程序,启动并附加到该程序。

默认情况下,没有参数,Delve将编译当前目录中的“main”包,并开始调试它。或者,您可以指定一个包名,Delve将编译该包,并开始一个新的调试会话。

Usage:
  dlv debug [package] [flags]

Flags:
      --output string   二进制文件的输出路径. (default "debug")

Global Flags:和上面的一样,这里省略
1). 举例说明,首先要进行调试的代码为test.go:
package main

import (
    "fmt"
    "time"
)

func counting(c chan<- int){
    for i := 0; i < 10; i++{
        time.Sleep(2 * time.Second)
        c <- i
    }
    close(c)
}

func main() {
    msg := "Starting main"
    fmt.Println(msg)
    bus := make(chan int)
    msg = "starting a gofunc"
    go counting(bus)
    for count := range bus{
        fmt.Println("count : ", count)
    }
}
2). 然后开启调试:
$ dlv debug test.go
Type 'help' for list of commands.
(dlv)
运行这个命令,dlv会去编译test.go代码,然后传一些参数给编译器,好让编译器编译出来更加方便调试的可执行文件,然后启动了你的程序,并且attach上去,这样,我们的终端或命令行就会停留在debug模式,应用只是启动了,但还没有开始执行,如果带参数启动程序后面需要加 -- arg1 arg2
3). 然后我们可以输入help查看可用的命令
The following commands are available:
    args ------------------------ 打印函数参数.
    break (alias: b) ------------ 设置断点.
    breakpoints (alias: bp) ----- 输出活动断点的信息.
    call ------------------------ 恢复进程,注入一个函数调用(还在实验阶段!!)
    clear ----------------------- 删除断点.
    clearall -------------------- 删除多个断点.
    condition (alias: cond) ----- 设置断点条件.
    config ---------------------- 修改配置参数.
    continue (alias: c) --------- 运行到断点或程序终止.
    deferred -------------------- 在延迟调用的上下文中执行命令.
    disassemble (alias: disass) - 反汇编程序.
    down ------------------------ 将当前帧向下移动.
    edit (alias: ed) ------------ 在$DELVE_EDITOR或$EDITOR中打开你所在的位置
    exit (alias: quit | q) ------ 退出调试器.
    frame ----------------------- 设置当前帧,或在不同的帧上执行命令.
    funcs ----------------------- 打印函数列表.
    goroutine ------------------- 显示或更改当前goroutine
    goroutines ------------------ 列举程序goroutines.
    help (alias: h) ------------- 打印帮助信息.
    list (alias: ls | l) -------- 显示源代码.
    locals ---------------------- 打印局部变量.
    next (alias: n) ------------- 转到下一个源行.
    on -------------------------- 在命中断点时执行命令.
    print (alias: p) ------------ 计算一个表达式.
    regs ------------------------ 打印CPU寄存器的内容.
    restart (alias: r) ---------- 重启进程.
    set ------------------------- 更改变量的值.
    source ---------------------- 执行包含delve命令列表的文件
    sources --------------------- 打印源文件列表.
    stack (alias: bt) ----------- 打印堆栈跟踪信息.
    step (alias: s) ------------- 单步执行程序.
    step-instruction (alias: si)  单步执行一条cpu指令.
    stepout --------------------- 跳出当前函数.
    thread (alias: tr) ---------- 切换到指定的线程.
    threads --------------------- 打印每个跟踪线程的信息.
    trace (alias: t) ------------ 设置跟踪点.
    types ----------------------- 打印类型列表
    up -------------------------- 向上移动当前帧.
    vars ------------------------ 打印包变量.
    whatis ---------------------- 打印表达式的类型.
在命令前键入help来获得命令的完整文档,如help goroutine
4). 开始进行调试,这里先什么都不做直接输入continue,即c,运行到断点或程序终止
(dlv) c
Starting main
count :  0
count :  1
count :  2
count :  3
count :  4
count :  5
count :  6
count :  7
count :  8
count :  9
Process 1324 has exited with status 0
可见代码跑了一遍
5). restart(缩写r)重启进程
(dlv) b main.main
Process 1324 has exited with status 0
注意:上面进行添加断点的操作,但是并没有返回想要的信息 这是因为我们之前已经将程序运行结束了,这时候不能直接添加断点信息 所以要先调用restart来将进程重启
6). break(即b)添加断点,现在我们可以为其添加断点了
(dlv) b main.main //在main函数处添加断点
Breakpoint 1 set at 0x10b123b for main.main() ./test.go:16
(dlv) b main.counting //在counting函数处添加断点
Breakpoint 2 set at 0x10b118f for main.counting() ./test.go:8
输出信息里面告诉了我们断点的 ID和断点的位置,函数名和文件名以及所在行数
我们也可以使用"文件:行号"的格式来添加断点,如:
b test.go:8 //等价于在函数counting处添加断点`
然后继续运行程序,可见会先停在main函数处:
(dlv) c
> main.main() ./test.go:16 (hits goroutine(1):1 total:1) (PC: 0x10b123b)
    11:            c <- i
    12:        }
    13:        close(c)
    14:    }
    15:
=>  16:    func main() {
    17:        msg := "Starting main"
    18:        fmt.Println(msg)
    19:        bus := make(chan int)
    20:        msg = "starting a gofunc"
    21:        go counting(bus)
7). breakpoints(缩写bp)输出活动断点信息
(dlv) bp
Breakpoint runtime-fatal-throw at 0x102b3e0 for runtime.fatalthrow() /usr/local/Cellar/go/1.11.4/libexec/src/runtime/panic.go:654 (0)
Breakpoint unrecovered-panic at 0x102b450 for runtime.fatalpanic() /usr/local/Cellar/go/1.11.4/libexec/src/runtime/panic.go:681 (0)
    print runtime.curg._panic.arg
Breakpoint 1 at 0x10b123b for main.main() ./test.go:16 (1)
Breakpoint 2 at 0x10b118f for main.counting() ./test.go:8 (0)
我们发现除了我们自己设置的main.main函数断点外,Delve内部已经为panic异常函数也设置了断点
8). list 显示从停止行起前后5行的源代码
(dlv) list
> main.main() ./test.go:16 (hits goroutine(1):1 total:1) (PC: 0x10b123b)
    11:            c <- i
    12:        }
    13:        close(c)
    14:    }
    15:
=>  16:    func main() {
    17:        msg := "Starting main"
    18:        fmt.Println(msg)
    19:        bus := make(chan int)
    20:        msg = "starting a gofunc"
    21:        go counting(bus)
9). next (缩写n)跳到下一行,可见现在的指针从16行转到了17行,如果想继续向下,可以直接回车,Delve会默认重复上一条命令
(dlv) n
> main.main() ./test.go:17 (PC: 0x10b1252)
    12:        }
    13:        close(c)
    14:    }
    15:
    16:    func main() {
=>  17:        msg := "Starting main"
    18:        fmt.Println(msg)
    19:        bus := make(chan int)
    20:        msg = "starting a gofunc"
    21:        go counting(bus)
    22:        for count := range bus{
10). print(缩写p)计算一个表达式,在这里用来打印一个变量的值,举例看下面
11). locals 打印局部变量,举例看下面
12). step(缩写s)单步执行程序
(dlv) p msg
"H�\a\x00�\x00\x00\x00��\x05\x01\x00\x00\x00\x00\x00\x03\x00\x00�\x00\x00\x00��\a\x00�\x00\x00\x00�Q\x00\x01\x00\x00\x00\x00X�\x06\x00�\x00\x00\x00\x00\x00\x00\x00\x00\x00\x00\x00�\x0f\v\x01\x00\x00\x00\x00...+16825344 more"
(dlv) locals
msg = "H�\a\x00�\x00\x00\x00��\x05\x01\x00\x00\x00\x00\x00\x03\x00\x00�\x00\x00\x00��\a\x00�\x00\x00\x00�Q\x00\x01\x00\x00\x00\x00X�\x06\x00�\x00\x00\x00\x00\x00\x00\x00\x00\x00\x00\x00�\x0f\v\x01\x00\x00\x00\x00...+16825344 more"
(dlv) p count
Command failed: could not find symbol value for count
(dlv) s
> main.main() ./test.go:18 (PC: 0x10b1267)
    13:        close(c)
    14:    }
    15:
    16:    func main() {
    17:        msg := "Starting main"
=>  18:        fmt.Println(msg)
    19:        bus := make(chan int)
    20:        msg = "starting a gofunc"
    21:        go counting(bus)
    22:        for count := range bus{
    23:            fmt.Println("count : ", count)
(dlv) p msg
"Starting main"
(dlv) locals
msg = "Starting main"
在执行s前,先使用p打印了msg局部变量的值,locals打印了局部变量的值,因为还没有运行到给msg赋值的代码,所以返回的结果不是期望的值,然后当我们运行s后,可见指针也从17变成了18,然后这时候再运行p和locals,可见返回了期望的值
print还可以用来判断一个表达式:
(dlv) p msg == "Starting main"
true
13). whatis打印表达式类型
(dlv) whatis msg
string
能够得到msg变量为string类型
14). 然后我们接着运行到下一个断点,这时候开启了一个groutine
(dlv) c
Starting main
> main.counting() ./test.go:8 (hits goroutine(18):1 total:1) (PC: 0x10b118f)
     3:    import (
     4:        "fmt"
     5:        "time"
     6:    )
     7:
=>   8:    func counting(c chan<- int){
     9:        for i := 0; i < 10; i++{
    10:            time.Sleep(2 * time.Second)
    11:            c <- i
    12:        }
    13:        close(c)
15). goroutine 命令
(dlv) help goroutine

    goroutine
    goroutine <id>
    goroutine <id> <command>

调用时不带参数,它将显示关于当前goroutine的信息。
使用单个参数调用时,它将切换到指定的goroutine。
使用更多参数调用时,它将在指定的goroutine上执行命令。
可见现在正在运行的goroutine
(dlv) goroutine
Thread 77795 at ./test.go:8
Goroutine 18:
    Runtime: ./test.go:8 main.counting (0x10b118f)
    User: ./test.go:8 main.counting (0x10b118f)
    Go: ./test.go:21 main.main (0x10b138a)
    Start: ./test.go:8 main.counting (0x10b1180)
指定查看的是goroutine 1 :
(dlv) goroutine 1
Switched from 18 to 1 (thread 77795)
(dlv) goroutine
Thread 77795 at ./test.go:8
Goroutine 1:
    Runtime: /usr/local/Cellar/go/1.11.4/libexec/src/runtime/proc.go:303 runtime.gopark (0x102d0f4)
    User: ./test.go:22 main.main (0x10b13ae)
    Go: /usr/local/Cellar/go/1.11.4/libexec/src/runtime/asm_amd64.s:201 runtime.rt0_go (0x10557fb)
    Start: /usr/local/Cellar/go/1.11.4/libexec/src/runtime/proc.go:110 runtime.main (0x102cb60)
要回去原来的goroutine就调用:
(dlv) goroutine 18
Switched from 1 to 18 (thread 77795)
16). goroutines 列举程序goroutines
(dlv) help goroutines
列举程序goroutines.

    goroutines [-u (default: user location)|-r (runtime location)|-g (go statement location)|-s (start location)] [ -t (stack trace)]

Print out info for every goroutine. The flag controls what information is shown along with each goroutine:

    -u  显示用户代码中最顶层堆栈帧的位置
    -r  显示最顶层stackframe的位置(包括私有运行时函数中的帧)
    -g  显示创建goroutine的go指令的位置
    -s  显示起始函数的位置
    -t  显示goroutine的堆栈跟踪

如果没有指定具体的标志,则默认使用-u.
(dlv) goroutines
  Goroutine 1 - User: ./test.go:22 main.main (0x10b13ae)
  Goroutine 2 - User: /usr/local/Cellar/go/1.11.4/libexec/src/runtime/proc.go:303 runtime.gopark (0x102d0f4)
  Goroutine 3 - User: /usr/local/Cellar/go/1.11.4/libexec/src/runtime/proc.go:303 runtime.gopark (0x102d0f4)
  Goroutine 17 - User: /usr/local/Cellar/go/1.11.4/libexec/src/runtime/proc.go:303 runtime.gopark (0x102d0f4)
* Goroutine 18 - User: ./test.go:8 main.counting (0x10b118f) (thread 77795)
[5 goroutines]
(dlv) goroutines -s
  Goroutine 1 - Start: /usr/local/Cellar/go/1.11.4/libexec/src/runtime/proc.go:110 runtime.main (0x102cb60)
  Goroutine 2 - Start: /usr/local/Cellar/go/1.11.4/libexec/src/runtime/proc.go:243 runtime.forcegchelper (0x102ced0)
  Goroutine 3 - Start: /usr/local/Cellar/go/1.11.4/libexec/src/runtime/mgcsweep.go:46 runtime.bgsweep (0x1020170)
  Goroutine 17 - Start: /usr/local/Cellar/go/1.11.4/libexec/src/runtime/mfinal.go:161 runtime.runfinq (0x1017ae0)
* Goroutine 18 - Start: ./test.go:8 main.counting (0x10b1180) (thread 77795)
[5 goroutines]
17). args 打印函数参数,得到counting函数的参数值:
(dlv) args
c = chan<- int 0/0
因为之前只设置了两个断点,因此再次调用c则又将运行程序完毕:
(dlv) c
count :  0
count :  1
...
18). stepout 跳出当前函数
(dlv) restart
Process restarted with PID 1352
(dlv) b main.main //之前的断点一直存在,即使程序结束,因此此时的counting函数中也有断点
Command failed: Breakpoint exists at /Users/user/go-learning/test.go:16 at 10b123b
(dlv) c
> main.main() ./test.go:16 (hits goroutine(1):1 total:1) (PC: 0x10b123b)
    11:         c <- i
    12:     }
    13:     close(c)
    14: }
    15:
=>  16: func main() {
    17:     msg := "Starting main"
    18:     fmt.Println(msg)
    19:     bus := make(chan int)
    20:     msg = "starting a gofunc"
    21:     go counting(bus)
(dlv) stepout
Starting main
> main.counting() ./test.go:8 (hits goroutine(5):1 total:1) (PC: 0x10b118f)
    breakpoint hit during stepout, continuing...
count :  0
count :  1
count :  2
...
因为stepout跳过的是main()函数,可见直接也跳过了counting的断点,然后执行程序到结束
19). clear删除断点\clearall删除多个断点 因为如果不手动清除断点,即使程序结束并restart程序,断点信息也仍然在
(dlv) breakpoints //查看当前的断点信息
Breakpoint runtime-fatal-throw at 0x102b3e0 for runtime.fatalthrow() /usr/local/Cellar/go/1.11.4/libexec/src/runtime/panic.go:654 (0)
Breakpoint unrecovered-panic at 0x102b450 for runtime.fatalpanic() /usr/local/Cellar/go/1.11.4/libexec/src/runtime/panic.go:681 (0)
    print runtime.curg._panic.arg
Breakpoint 1 at 0x10b123b for main.main() ./test.go:16 (1)
Breakpoint 2 at 0x10b118f for main.counting() ./test.go:8 (0)
(dlv) clear 1 //先删除第一个断点,即main函数上的断点
Breakpoint 1 cleared at 0x10b123b for main.main() ./test.go:16
(dlv) breakpoints //查看可见果然成功删除
Breakpoint runtime-fatal-throw at 0x102b3e0 for runtime.fatalthrow() /usr/local/Cellar/go/1.11.4/libexec/src/runtime/panic.go:654 (0)
Breakpoint unrecovered-panic at 0x102b450 for runtime.fatalpanic() /usr/local/Cellar/go/1.11.4/libexec/src/runtime/panic.go:681 (0)
    print runtime.curg._panic.arg
Breakpoint 2 at 0x10b118f for main.counting() ./test.go:8 (0)
(dlv) clearall //然后将所有断点都删除
Breakpoint 2 cleared at 0x10b118f for main.counting() ./test.go:8
(dlv) breakpoints //查看可见断点信息为空
Breakpoint runtime-fatal-throw at 0x102b3e0 for runtime.fatalthrow() /usr/local/Cellar/go/1.11.4/libexec/src/runtime/panic.go:654 (0)
Breakpoint unrecovered-panic at 0x102b450 for runtime.fatalpanic() /usr/local/Cellar/go/1.11.4/libexec/src/runtime/panic.go:681 (0)
    print runtime.curg._panic.arg
(dlv)
20). on 在命中断点时执行命令
(dlv) help on
Executes a command when a breakpoint is hit.

    on <breakpoint name or id> <command>.

Supported commands: print, stack and goroutine)
21). set 更改变量的值
(dlv) help set
Changes the value of a variable.

    [goroutine <n>] [frame <m>] set <variable> = <value>
set只能更改数值变量和指针 因此更改string类型变量将报错:
(dlv) set msg = "change msg"
Command failed: can not set variables of type string (not implemented)
22). exit (alias: quit | q)退出调试器
(dlv) exit
dlv attach
如果项目正在运行中,想要对正在运行的项目进行调试
1)首先使用"ps aux | grep 编译文件名"来查看运行程序的进程号pid
2)然后就能够使用"dlv attach pid"来连接该运行程序,然后就能使用之前debug中的命令来进行调试了
GoLand + Delve:远程调试
前面的例子有使用Delve启动应用或attach到应用进行调试,但添加断点,运行到下一步,查看变量值等操作都是在终端中,输入delve命令来进行的。这种调试方式也太古老了,效率低下。真实场景下,几乎不会使用这种方式来进行调试。我们还是希望借助IDE进行更高效的调试。 下面就介绍如何在GoLand中配合delve进行调试。包括附加到进程调试和远程调试。其实附加到本地进程和远程调试原理是一样的,待调试的进程是通过delve启动的,delve会启动进程,并立即附加到进程,开启一个debug session。并且启动一个debug server,暴露某个端口,客户端IDE可以通过该端口连接到debug server进行调试。
1. 远程调试Debug优点
- 极大的加快开发速度,减少给在代码中使用大量log来定位错误.
- 最大程度的使用linux远程服务器环境, 极大的简化本地部署模拟服务器环境
- 可以绕过数据库内网的限制
- 不用依赖日志来定位错误(开发效率太低)
- 完美的解决一些不支持windows开发的依赖
2. 准备条件
- 安装好了GoLand。
- 安装好了delve,并将dlv添加到$PATH中。
具体使用 delve 调试还是比较简单的,只需要两步:
- 正确编译代码
- Go 1.10 及以上
go build -gcflags "all=-N -l" github.com/app/demo
- Go 1.9 及以下
go build -gcflags "-N -l" github.com/app/demo
3. 方式一
第一步:
在服务器上运行 delve 服务器 运行 delve 服务器有几种形式,可以是用 delve 运行 Go 代码,也可以是运行可执行程序,也可以是侵入一个运行中的 Go 程序,一般来说,attach 一个运行中的 Go 程序比较常见:
[root@liqiang.io] dlv attach $PID --headless --api-version=2 --log --listen=:1234
这样 delve 服务器就起来了,然后继续下一步就是 Goland 连接调试。
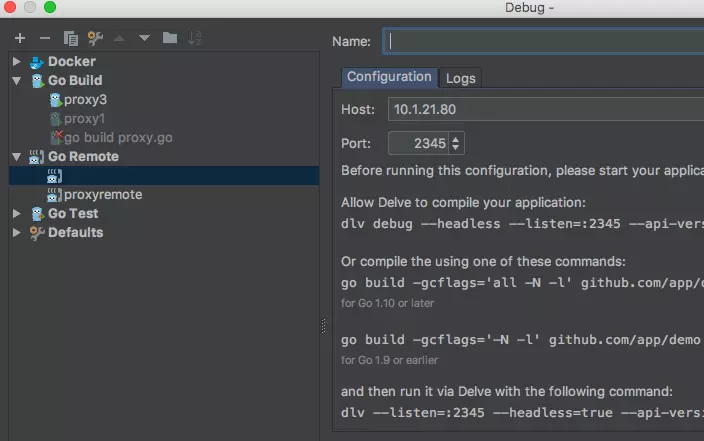
第二步:
在 Goland 中连接 delve 服务器
直接在 Goland 中配置 Host 和 Port 即可,然后在源代码中选择这个 “Go Remote” 调试器进行调试:
4. 方式二
第一步:
[root@php]# dlv --listen=:2345 --headless=true --api-version=2 --accept-multiclient exec ./demo
第二步:
参考方式一第二步
注意点: 本地代码要与远端一致
接下来,就可以使用goland进行调试了, 附一张图方便大家查看
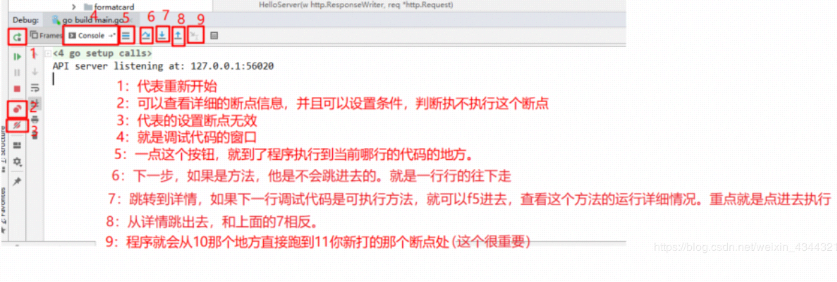
以上就是本篇文章的全部内容,希望可以帮到大家!
使用GoLand调试的要领可以参考:
参考文章
