

最近给实验室工作时,接到了一个奇怪的可视化需求,要求做一个潮汐日历图,像是这个样子:
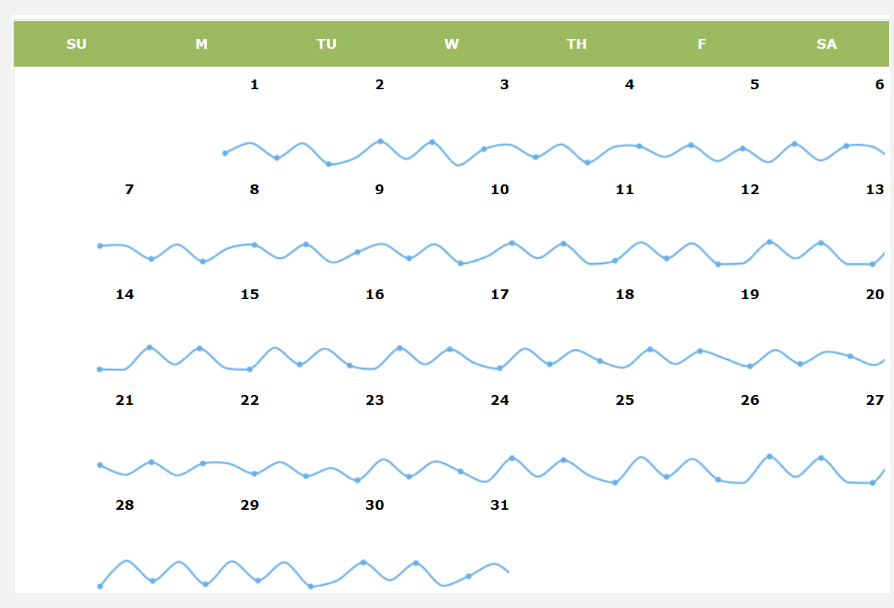
一时间没有什么太好的想法,借鉴了echart实例中在日历图中添加饼图的思路,在每个日历图的格子中依次渲染echart图标,具体代码如下:
var dom = document.getElementById("container");
			var myChart = echarts.init(dom);
			var app = {};
			option = null;
			var cellSize = [100, 80];

			function getVirtulData() {
				var date = +echarts.number.parseDate('2017-03-01');
				var end = +echarts.number.parseDate('2017-04-01');
				var dayTime = 3600 * 24 * 1000;
				var data = [];
				for (var time = date; time < end; time += dayTime) {
					data.push([
						echarts.format.formatTime('yyyy-MM-dd', time),
						Math.floor(Math.random() * 10000)
					]);
				}
				return data;
			};

			function getLineSeries(scatterData, chart) {
				return echarts.util.map(scatterData, function(item, index) {
					center = chart.convertToPixel('calendar', item);
					return {
						type: 'line',
						id: index + 'line',
						label: {
							normal: {
								formatter: '{c}'

							}
						},
						itemStyle: {
							normal: {
								color: '#80bcec',
								borderWidth: 1,
								lineStyle: {
									color: '#80bcec'
								}
							}
						},
						xAxisIndex: index,
						yAxisIndex: index,
						data: [{
								name: '0',
								value: 4
							},
							{
								name: '1',
								value: 3
							},
							{
								name: '2',
								value: 4
							},
							{
								name: '0',
								value: 0
							},
							{
								name: '1',
								value: 3
							},
							{
								name: '2',
								value: 4
							},
							{
								name: '0',
								value: 0
							},
							{
								name: '1',
								value: 3
							},
							{
								name: '2',
								value: 4
							}
						]
					};
				});
			};

			function getgrid(scatterData, chart) {
				return echarts.util.map(scatterData, function(item, index) {
					center = chart.convertToPixel('calendar', item);
					console.log(center[0]);
					return {
						/* id: index + 'grid', */
						left: center[0] - 50,
						top: center[1],
						width: '100',
						height: '30'
					};
				});
			}

			function getxaxis(scatterData, chart) {
				return echarts.util.map(scatterData, function(item, index) {
					center = chart.convertToPixel('calendar', item);
					return {
						/* id: index + 'grid', */
						type: 'category',
						name: 'time',
						gridIndex: index,
						boundaryGap: false,
						show: false
					};
				});
			}

			function getyaxis(scatterData, chart) {
				return echarts.util.map(scatterData, function(item, index) {
					center = chart.convertToPixel('calendar', item);
					return {
						/* id: index + 'grid', */
						type: 'value',
						name: 'height',
						gridIndex: index,
						show: false
					};
				});
			}

			function getLineSeriesUpdate(scatterData, chart) {
				return echarts.util.map(scatterData, function(item, index) {
					var center = chart.convertToPixel('calendar', item);
					return {
						id: index + 'line',
						center: center
					};
				});
			}

			var scatterData = getVirtulData();
			option = {
				calendar: {
					top: 'middle',
					left: 'center',
					orient: 'vertical',
					cellSize: cellSize,
					yearLabel: {
						show: false,
						textStyle: {
							fontSize: 30
						}
					},
					dayLabel: {
						margin: 20,
						firstDay: 1,
						nameMap: ['星期日', '星期一', '星期二', '星期三', '星期四', '星期五', '星期六']
					},
					monthLabel: {
						show: false
					},
					range: ['2017-03']
				},
				series: [{
					id: 'label',
					type: 'scatter',
					coordinateSystem: 'calendar',
					symbolSize: 1,

					label: {
						normal: {
							show: true,
							formatter: function(params) {
								return echarts.format.formatTime('dd', params.value[0]);
							},
							offset: [-cellSize[0] / 2 + 10, -cellSize[1] / 2 + 10],
							textStyle: {
								color: '#000',
								fontSize: 14
							}
						}
					},
					data: scatterData
				}]
			};

			if (option && typeof option === "object") {
				myChart.setOption(option, true);
			}

			setTimeout(function() {
				myChart.setOption({
					series: getLineSeries(scatterData, myChart),
					grid: getgrid(scatterData, myChart),
					xAxis: getxaxis(scatterData, myChart),
					yAxis: getyaxis(scatterData, myChart)
				});
			}, 10);
