

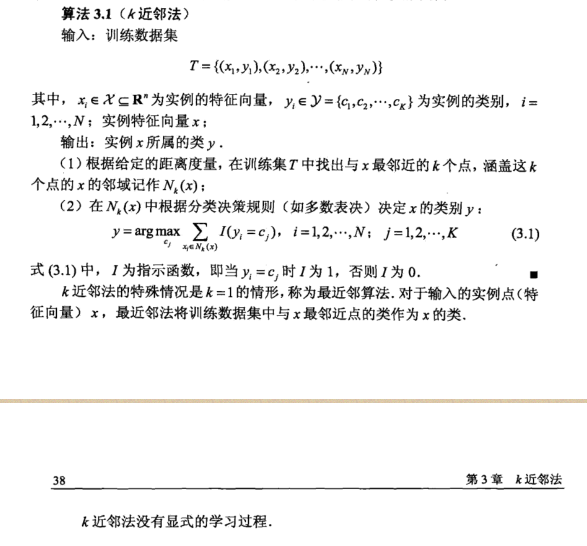
KNN(K-Nearest Neighbors Algorithm)
1.工作原理
存在一个样本数据集合,也称作训练样本集,并且样本
存在一个样本数据集合,也称作训练样本集,并且样本
集中每个数据都存在标签,即我们知道样本集中每个数 据与所属分类的对应关系。
输入没有标签的新数据后,将新数据的每个特征与样本 集中数据对应的特征进行比较,然后算法提取样本集中 特征最相似数据(最近邻)的分类标签。
一般来说,只选择样本数据集中前N个最相似的数据。K 一般不大于20,最后,选择k个中出现次数最多的分类,
作为新数据的分类
2.算法流程
收集数据:可以使用任何方法
准备数据:距离计算所需要的数值,最后是结构化的数 据格式。
分析数据:可以使用任何方法
训练算法: (此步骤kNN)中不适用
测试算法:计算错误率
使用算法:首先需要输入样本数据和结构化的输出结果,
然后运行k-近邻算法判定输入数据分别属于哪个分类, 最后应用对计算出的分类执行后续的处理。
3.K值的选择
如果选择较小的K值 :a.“学 习”的近似误差(approximation error)会减小,但 “学习”的估计误差(estimation error) 会增大,
b.噪声敏感,c.K值的减小就意味着整体模型变得复杂,容易发生过 拟 合.
b.噪声敏感,c.K值的减小就意味着整体模型变得复杂,容易发生过 拟 合.
如果选择较大的K值:a.减少学习的估计误差,但缺点是学习的近似误差会增大.同时K值的增大 就意味着整体的模型变得简单.
4.代码实现
(1) iris 数据集分类效果进行预测,使用代码中的2维数据进行可视化,使用sklearn
- importnumpyasnp
- importmatplotlib.pyplotasplt
- frommatplotlib.colorsimportListedColormap
- fromsklearnimportneighbors
- importpandasaspd
n_neighbors =15- # import some data to play with
path ='./iris.data'
iris = np.array(pd.read_csv(path, header=None))- # we only take the first two features. We could avoid this ugly
- # slicing by using a two-dim dataset
X = iris[:, :2]
y = pd.Categorical(iris[:,4]).codes
h =.02# step size in the mesh- # Create color maps
cmap_light = ListedColormap(['#FFAAAA','#AAFFAA','#AAAAFF'])
cmap_bold = ListedColormap(['#FF0000','#00FF00','#0000FF'])- forweightsin['uniform','distance']:
# we create an instance of Neighbours Classifier and fit the data.
clf = neighbors.KNeighborsClassifier(n_neighbors, weights=weights)
clf.fit(X, y)
# Plot the decision boundary. For that, we will assign a color to each
# point in the mesh [x_min, x_max]x[y_min, y_max].
x_min, x_max = X[:,0].min() -1, X[:,0].max() +1
y_min, y_max = X[:,1].min() -1, X[:,1].max() +1
xx, yy = np.meshgrid(np.arange(x_min, x_max, h),
np.arange(y_min, y_max, h))
Z = clf.predict(np.c_[xx.ravel(), yy.ravel()])
# Put the result into a color plot
Z = Z.reshape(xx.shape)
plt.figure()
plt.pcolormesh(xx, yy, Z, cmap=cmap_light)
# Plot also the training points
plt.scatter(X[:,0], X[:,1], c=y, cmap=cmap_bold,
edgecolor='k', s=20)
plt.xlim(xx.min(), xx.max())
plt.ylim(yy.min(), yy.max())
plt.title("3-Class classification (k = %i, weights = '%s')"
% (n_neighbors, weights))
plt.show()
(2)knn算法的Python实现,使用的欧氏距离
- importnumpyasnp
- importoperator
- # Python实现
- # inx 测试样本
- # dataSet,labels训练样本及其标签
- # k最近近邻范围
def classify0(inX, dataSet, labels, k):
dataSetSize = dataSet.shape[0]
diffMat = np.tile(inX, (dataSetSize,1)) - dataSet
sqDiffMat = diffMat**2
sqDistances = sqDiffMat.sum(axis=1)
distances = sqDistances**0.5
sortedDistIndicies = distances.argsort()
classCount={}
foriinrange(k):
voteIlabel = labels[sortedDistIndicies]
classCount[voteIlabel] = classCount.get(voteIlabel,0) +1
sortedClassCount = sorted(classCount.iteritems(), key=operator.itemgetter(1), reverse=True)
returnsortedClassCount[0][0]
更多免费技术资料可关注:annalin1203
