

摘要:在Kubernetes整个体系中,弹性伸缩是至关重要的功能,其分为两种:水平弹性伸缩(Horizontal Pod Autoscaling,简称HPA)和垂直弹性伸缩(Vertical Pod Autoscaler,简称VPA)。前者根据指定的指标负载自动调整pod的实例数,后者可以根据资源实际使用情况为其pods中的容器设置最新的资源配额request。这两者合理使用可以在满足业务对实例数的要求下同时充分提升集群资源的利用率。本文对k8s原生HPA组件的原理进行深入分析,以及对其从k8s的kube-controller-manager中分离进行自定义增强特性的独立组件开发,姑且称为HPAPlus-Controller。同时对整个HPA体系架构进行讲解,以及适配公司自研业务上云平台中业务需求的整个体系设计及实现,主要涵盖以下内容:HPA原理分析、HPAPlus-Controller实现、custom-metrics-adapter、external-metrics-adapter、metrics-server、promethus、monitor指标数据采集、定时HPA、动态调整HPA minReplicas、以及使用示例。
1 HPA 介绍及原理
1.1 相关说明
(1) Kubernetes版本1.12.4 (2) 基于kubernetes controller manager 子组件Horizontal Pod Autoscaler (3) HPAPlus-Controller 工作及计算原理与HPA 大同小异,因此基本概念及原理以HPA为介绍
1.2 HPA概念与yaml格式
1.2.1 概念
HPA(Horizontal Pod Autoscaling)是kubernetes中自动水平扩展模块,基于用户设定和获取到的指标(CPU,Memory,自定义metrics),对Pod进行伸缩,不是直接操作pod,而是通过scaler client修改Replicas副本数来实现Pod实例数的增减。HPA Controller属于Controller Manager的一个controller。HPA的操作对象是RC、RS或Deployment对应的Pod根据观察到的CPU等实际使用量与用户的期望值进行比对,做出是否需要增减实例数量的决策。
1.2.2 yaml使用格式
在kubernetes(github.com/kubernetes/…)目录pkg /apis/ autoscaling下可以看到,HorizontalPodAutoscaler 有3个版本 ,v1、v2beta1、v2beta2。v1(仅支持CPU指标),v2beta1(支持CPU和Memory和自定义指标(Pods、Objects)),v2beta2 支持外部接口定义指标(External)。各版本yaml文件如下,后面讲解其在HPA Controller中各自client与metrics apiserver/adapter的对接链路关系。
V1 版本:
apiVersion: autoscaling/v1
kind: HorizontalPodAutoscaler
metadata:
  name: php-apache
  namespace: default
spec
  scaleTargetRef:
    apiVersion: apps/v1
    kind: Deployment
    name: php-apache
  minReplicas: 1
  maxReplicas: 10
  targetCPUUtilizationPercentage: 50
V2beta1版本:
kind: HorizontalPodAutoscaler
apiVersion: autoscaling/v2beta1
metadata:
  name: example-hpa
spec:
  scaleTargetRef:
    apiVersion: apps/v1
    kind: Deployment
    name: example-app
  minReplicas: 2
  maxReplicas: 10
  metrics:
  - type: Resource
    resource:
      name: cpu
      targetAverageUtilization: 50
  - type: Resource
    resource:
      name: memory
      targetAverageUtilization: 50
  - type: Pods
    pods:
      metricName: receive_bytes_total
      targetAverageValue: 100
  - type: Object
    object:
      target:
        kind: endpoints
        name: example-app
      metricName: request_total
      targetValue: 500m
v2beta2版本:
apiVersion: autoscaling/v2beta2
kind: HorizontalPodAutoscaler
metadata:
  name: hpa-test
  namespace: dev
  annotations:metric-config.external.prometheus-query.prometheus/autoregister_queue_latency: autoregister_queue_latency{endpoint="https",instance="192.168.99.101:8443",job="apiserver",namespace="default",quantile="0.99",service="kubernetes"}
spec:
  scaleTargetRef:
    apiVersion: extensions/v1beta1
    kind: Deployment
    name: test
  minReplicas: 1
  maxReplicas: 10
  Metrics:
  - type: External
    external:
      metric:
        name: prometheus-query
        selector:
          matchLabels:
            query-name: autoregister_queue_latency
      target:
        type: AverageValue
        averageValue: 1
1.3 HPA工作原理
1.3.1 计算方法
HPA 是根据实际工作负载水平伸缩容器数目的组件,基于两个非常简单的数学公式原理,计算的结果是向上取整:
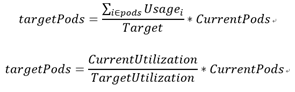
TargetUtilization 和Target 的为目标利用率和目标利用值(平均值或总量值)。以下分别以设置目标利用率或目标利用值。以下简单举例说明:
- type Reource设置CPU利用率为40% 假设存在一个叫 A 的 Deployment,包含3个 Pod,每个副本的 Request 值是 1核,当前获取的每个pod的CPU使用值为0.5,0.8,0.7,则 当前pod的总cpu利用率:x=(0.5+0.7+0.8)/(3*1)=66.7% 根据上面公式:targetPods=(66.7%)/(40%)*3=5
- 设pods资源类型,以网络接收字节数receive_bytes_total为指标计算, 目标平均值targetAverageValue为100 假设存在一个叫 A 的 Deployment,包含3个 Pod,当前获取的每个pod的receive_bytes_total使用值为120,150,200,则当前pods的receive_bytes_total 总平均使用值 x=(130+150+200)/3=160,根据上面公式 targetPods =(160/100)*3=5 其他几种类型的计算方法类似,只是获取指标的来源方式不同。
1.3.2 启动流程
在k8s源码中,HPA功能模块是嵌在kube-controller-manager组件中。kube-controller-manager 包含了很多子模块控制机器,如常用的功能控制器:EndpointController、ReplicationController 、ResourceQuotaController、NamespaceController、ServiceAccountController、GarbageCollectorController、DaemonSetController、JobController、DeploymentController、ReplicaSetController、HPAController、StatefulSetController 、NodeIpamController、ServiceController、RouteController,这些控制器由kube-controller-manager统一以数组遍历方式启动,启动入口在kubernetes源码目录cmd/kube-controller-manager/app/controllermanager.go: NewControllerManagerCommand ->Run(c *config.CompletedConfig, stopCh <-chan struct{}) -> StartControllers-> NewControllerInitializers,NewControllerInitializers以map[string]func的方式注册个各子控制器,func方法是统一参数格式,HPA的执行启动入口为controllers["horizontalpodautoscaling"] = startHPAController。 在k8s v1.9之前,hpa的指标数据来源于heapster,后被metrics-server取代,并以聚合层方式支持自定义指标的apiserver方式扩展。从启动方式也可以看出,采用聚合的metrcis resclient方式启动时。需要使能horizontal-pod-autoscaler-use-rest-clients,本文的hpaplus-controller就是从这里分离hpa-controller作为独立组件进行扩展性开发,且启用的是metrics rest client方式,具体源码分析后面进行讲解。
func startHPAController(ctx ControllerContext) (http.Handler, bool, error) {
   if !ctx.AvailableResources[schema.GroupVersionResource{Group: "autoscaling", Version: "v1", Resource: "horizontalpodautoscalers"}] {
      return nil, false, nil
   }
   if ctx.ComponentConfig.HPAController.HorizontalPodAutoscalerUseRESTClients {
      // use the new-style clients if support for custom metrics is enabled
      return startHPAControllerWithRESTClient(ctx)
   }
   return startHPAControllerWithLegacyClient(ctx)
}
2 HPAPlus架构设计及实现
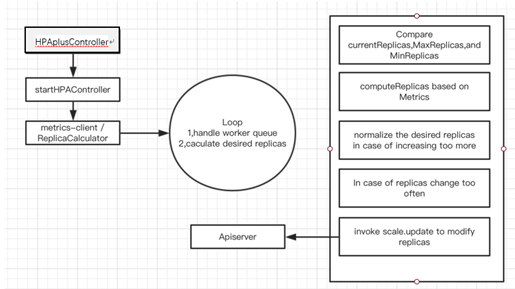
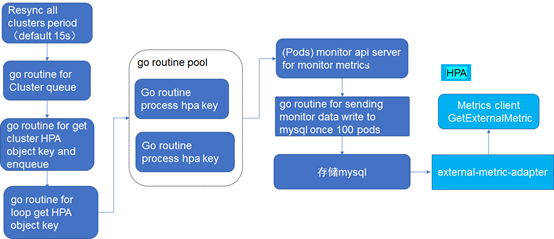
HPAPlus架构
在实际应用中,基于原生HPA系统架构实现适配业务自定义特性的整体设计架构如下:
其各特性的具体实现方式:
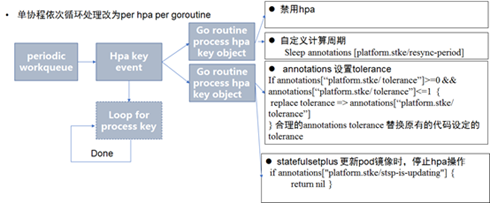
自定义计算周期最初sleep 睡眠方式存在问题,用户更新周期后得过了睡眠时间触发下一轮处理。因此已改为timer := time.NewTimer(timeDuration)方式:
    timer := time.NewTimer(timeDuration)
wait:
   for {
      select {
      case <-timer.C:
         break wait
      case <-a.updateResyncPeriodSignal[key]:
         glog.V(2).Infof("hpa object key %s metadata.annotations[platform.stke/resync-period] has been updated , stop old timer and continue execution", key)
         timer.Stop()
         break wait
      }
   }
2.2 HPAPlus-Controller主要执行流程
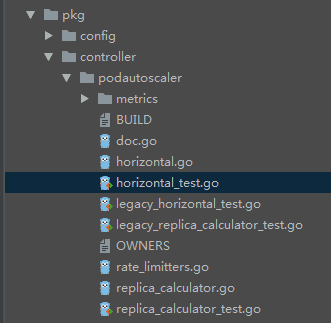
HPAPlus-Controller将k8s.io/kubernetes/pkg/controller/podautoscaler目录分离成独立工程,其保留原目录结构如下:
整体执行流程:
从cmd/kube-crontroller-manager/app/autoscaling startHPAController入口调用startHPAControllerWithMetricsClient->podautoscaler.NewHorizontalController开始分析,主要流程伪码:
Run(stopCh <-chan struct{}){
……
go wait.Until(a.worker, time.Second, stopCh)
<-stopCh
}
worker() {
// 原生单协程执行方法
//for processNextWorkItem() {//}//
//并发处理
processParallelWorkItem()
 }
for{
  get hpa key queue
  go func() {
   process(hpa)
  }
 }

if check current replicas & hpa edge contions{
minReplicas<=disiredReplicas<=maxReplicas
}else {
disiredReplicas=computeReplicasForMetrics
}

get scale object
scale.Spec.Replicas = desiredReplicas
update scale object
computeReplicasForMetrics方法则是hpa核心处理各类型metrics及计算目标副本数desireReplicas的逻辑。下面对核心接口及计算方法进行分析。
switch metricSpec.Type {
case autoscalingv2.ObjectMetricSourceType:
   metricSelector, err := metav1.LabelSelectorAsSelector(metricSpec.Object.Metric.Selector)
      replicaCountProposal, timestampProposal, metricNameProposal, err = a.computeStatusForObjectMetric(currentReplicas, metricSpec, hpa, selector, &statuses[i], metricSelector, tolerance)
case autoscalingv2.PodsMetricSourceType:
   metricSelector, err := metav1.LabelSelectorAsSelector(metricSpec.Pods.Metric.Selector)
    replicaCountProposal, timestampProposal, metricNameProposal, err = a.computeStatusForPodsMetric(currentReplicas, metricSpec, hpa, selector, &statuses[i], metricSelector, tolerance)
  case autoscalingv2.ResourceMetricSourceType:
   replicaCountProposal, timestampProposal, metricNameProposal, err = a.computeStatusForResourceMetric(currentReplicas, metricSpec, hpa, selector, &statuses[i], tolerance)
  case autoscalingv2.ExternalMetricSourceType:
   replicaCountProposal, timestampProposal, metricNameProposal, err = a.computeStatusForExternalMetric(currentReplicas, metricSpec, hpa, selector, &statuses[i], tolerance)
   default:
   errMsg := fmt.Sprintf("unknown metric source type %q", string(metricSpec.Type))
这段代码就是根据hpa yaml文件中不同类型的metrics,调用不同的metrics restclient从对应的apiserver中获取指标,参见图2-1及说明。三种资源类型由统一接口分别调用获取对应指标。
// MetricsClient knows how to query a remote interface to retrieve container-level
// resource metrics as well as pod-level arbitrary metrics
type MetricsClient interface {
   // GetResourceMetric gets the given resource metric (and an associated oldest timestamp)
   // for all pods matching the specified selector in the given namespace
   GetResourceMetric(resource v1.ResourceName, namespace string, selector labels.Selector) (PodMetricsInfo, time.Time, error)

   // GetRawMetric gets the given metric (and an associated oldest timestamp)
   // for all pods matching the specified selector in the given namespace
   GetRawMetric(metricName string, namespace string, selector labels.Selector, metricSelector labels.Selector) (PodMetricsInfo, time.Time, error)

   // GetObjectMetric gets the given metric (and an associated timestamp) for the given
   // object in the given namespace
   GetObjectMetric(metricName string, namespace string, objectRef *autoscaling.CrossVersionObjectReference, metricSelector labels.Selector) (int64, time.Time, error)

   // GetExternalMetric gets all the values of a given external metric
   // that match the specified selector.
   GetExternalMetric(metricName string, namespace string, selector labels.Selector) ([]int64, time.Time, error)
}
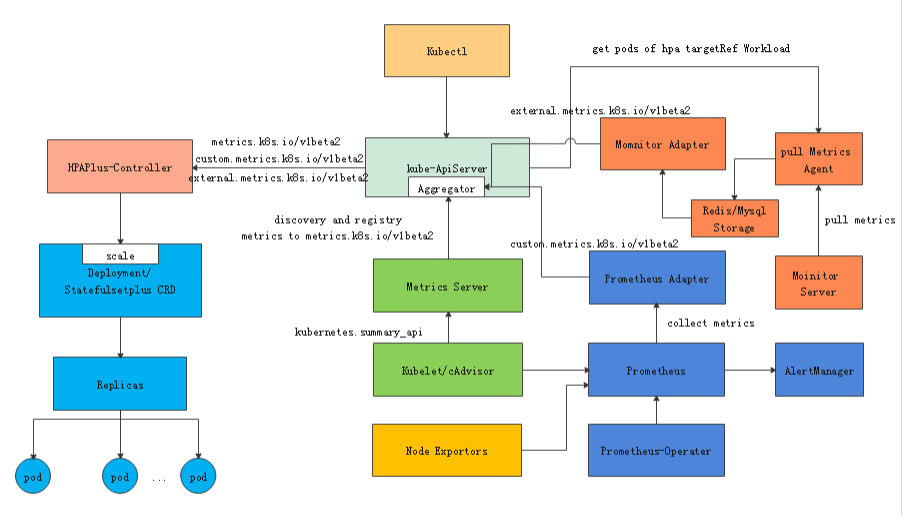
GetResourceMetric请求的是metrics-server通常获取workload的每个pod cpu/mem指标使用信息。GetRawMetric 、GetObjectMetric 对接的是custom-metrics-server,GetExternalMetric对接的是external-metrics-apiserver,两者分别有对应的adapter方法提供获取指标的标准接口,开发者只需按照自己的逻辑去实现对应接口,以及按照apiservice服务注册的方式进行部署。限于篇幅,在此不对custom-metrics-apiserver开发作详细讲解。有兴趣可参考 www.github.com/kubernetes-… 、github.com/DirectXMan1… external-metrics-apiserver组件设计实现。
2.3 HPA 核心计算方法
HPA的核心计算方法在pkg/controller/podautoscaler/replicator.go 文件中。计算公式参见1.3.1节式1.1 ,各类型主要计算流程如下。
•Reource 类型指标计算
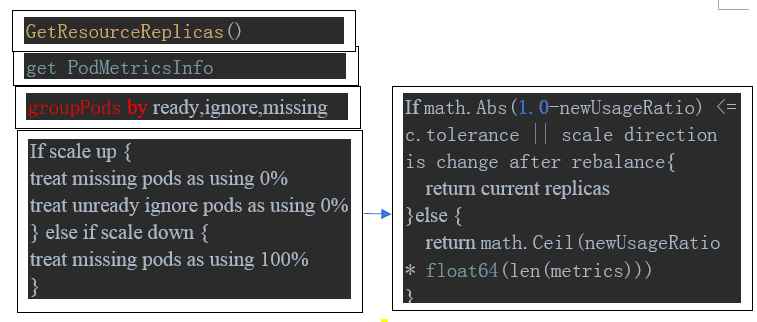
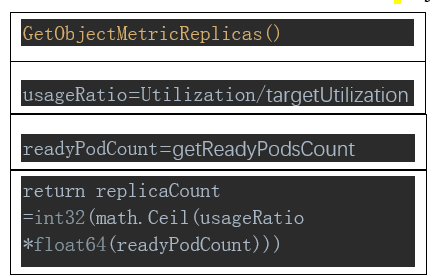
其中Pods类型计算方法与Resource类型类似,external 类型计算方法与Object类型类似 。读者可自行阅读源码分析。 groupPods方法初看有点费解,在此解析下。它是按照cpu资源为依据进行区分。missingPods则是不在metrics列表中。ignorePod则通过GetPodCondition获取pod的状态,判定true的条件: 1 在pod启动的5分钟内(pod的cpu初始化准备时间):如果condition或pod.Status.StartTime为空;否则,其状态为false或者metrics指标采集的时间不在上次状态转换的30s后(metrics窗口时间),即视为无效metrics; 2 在pod启动的5分钟后:状态为false且上一次状态转换时间在pod启动后的 30s内(delayOfInitialReadinessStatus),即从pod启动后30秒内的最后状态为false就一直处于unready状态未发生改变。其源码如下。
func groupPods(pods []*v1.Pod, metrics metricsclient.PodMetricsInfo, resource v1.ResourceName, cpuInitializationPeriod, delayOfInitialReadinessStatus time.Duration) (readyPodCount int, ignoredPods sets.String, missingPods sets.String) {
missingPods = sets.NewString()
	ignoredPods = sets.NewString()
	for _, pod := range pods {
		if pod.DeletionTimestamp != nil || pod.Status.Phase == v1.PodFailed {continue}
		metric, found := metrics[pod.Name]
		if !found {
			missingPods.Insert(pod.Name)
			continue
		}
		if resource == v1.ResourceCPU {
			var ignorePod bool
			_, condition := podutil.GetPodCondition(&pod.Status, v1.PodReady)
			if condition == nil || pod.Status.StartTime == nil {
				ignorePod = true
			} else {
	// Pod still within possible initialisation period.
	          If pod.Status.StartTime.Add(cpuInitializationPeriod).
After(time.Now()) {
	// Ignore sample if pod is unready or one window of metric wasn't collected since last state transition.
			ignorePod = condition.Status == v1.ConditionFalse || metric.Timestamp.Before(condition.LastTransitionTime.Time.Add(metric.Window))
				} else {
// Ignore metric if pod is unready and it has never been ready.
					ignorePod = condition.Status == v1.ConditionFalse && pod.Status.StartTime.Add(delayOfInitialReadinessStatus).After(condition.LastTransitionTime.Time)
				}}
			if ignorePod {
				ignoredPods.Insert(pod.Name)
				continue}}
		readyPodCount++}
  return
}
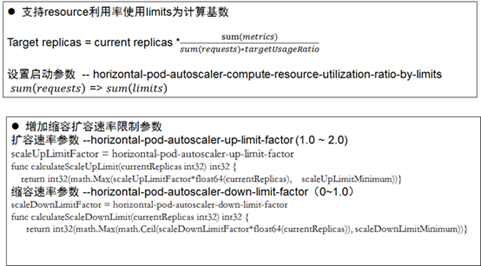
在初步计算得到的replicaCount即desiredReplicas后,还有个边界及扩缩容条件限制的校正。使其满足: 1 hpa minReplicas <= desiredReplicas <= hpa maxReplicas 2 when scale up , range 4~scaleUpLimitFactor(default 2)current in each period 3 when scale down, first keep 5min, after which it’s still below target, then range max(scaleDownLimitMinimum(1) ,scaleDownLimitFactor(0.5) current) ~ current in each period
2.3 Metrics-Apiserver 计算周期调优
为实现HPA计算响应周期为5s的目标,从cpu/mem指标的获取链路中,hpaplus-controller 、metrics-server、cadvisor都需控制在5s内。hpaplus-controller采用多协程很容易达到5s的处理周期,因此还需调优metrics-server(默认周期1min)、cadvisor(默认10s)。 源码github.com/kubernetes-… , Run(stopCh <-chan struct{})->mgr.RunUntil(stopCh) ,RunUntil代码:
go func() {
   ticker := time.NewTicker(rm.resolution)
   defer ticker.Stop()
   rm.Collect(time.Now())
   for {
      select {
      case startTime := <-ticker.C:
         rm.Collect(startTime)
      case <-stopCh:
         return
      }
   }
}()
可以看出它是以resolution 为间隔的timer ticker循环执行,因此在rm.Collect方法中必须在resolution周期内完成所有指标采集。在实际现网中,经过日志观察发现,出现有集群的处理时间达30s,即使node数才十几,pod数才几十至百,这显然不符合正常的计算时间。我们继续从rm.Collect中顺藤摸瓜找到继续往下调用的方法rm.source.Collect->pkg/sources/manager.go Collect(baseCtx context.Context),其中的处理逻辑为:
GetMetricSources(get node list) (pkg/sources/summary.go)
compute delayMs (prevent network blocking)
delayMs := delayPerSourceMs(8ms) * len(sources)
delayMs = max(delayMs, maxDelay(4s )) (500 node)
for range sources {
go func{
……
sleep rand.Intn(delayMs)) * time.Millisecond // 随机睡眠
ctx, cancelTimeout := context.WithTimeout(baseCtx, m.scrapeTimeout-sleepDuration) // 处理时间为,设定周期减去睡眠时间
defer cancelTimeout()
metrics, err := scrapeWithMetrics(ctx, source)
……
responseChannel <- metrics
errChannel <- err
}
}
for range sources {
responseChannel <- metrics
errChannel <- err
}
从上面处理逻辑可以得知,就是简单子协程生产者(第一个for)和主协程消费者模型(第二个for), 因此,相当于木桶原理,总处理时间取决于一个node的metrics最长处理时间,继续追寻调用链路: scrapeWithMetrics-> Collect(ctx context.Context) (pkg/sources/summary.go)-> GetSummary(ctx, src.node.ConnectAddress) (pkg/sources/client.go),最终为 node上的/stats/summary api http/https 请求。在调试日志中,发现某个node会在此耗时30s,而刚好此node端口不通或其他异常无返回,符合预期。可以得知此http client默认超时为30s,因此调整client 里的http DialTimeOut时间。考虑前面每个node的最大平均随机睡眠为2s,因此设置DialTimeOut为3s。另外,如果node处理metrics超过resolution的设置时间,它的goroutine会超时结束。
url := url.URL{
   Scheme:   scheme,
   Host:     net.JoinHostPort(host, strconv.Itoa(kc.port)),
   Path:     "/stats/summary",
   RawQuery: "only_cpu_and_memory=true",
}
req, err := http.NewRequest("GET", url.String(), nil)
修改了metrics-server源码的kubeletClient http的 DialTimeout配置为3s后,重新部署上线,目前线上每个集群几百个node处理周期都在5s内。 接下还有cadvisor, cadvisor是集成于kubelet中,其源码在kubernetes pkg/kubelet/cadvisor,本文就不分析其具体源码逻辑了。从源码中可以得知pod上的container指标刷新周期由HousekeepingInterval控制(默认10s),但提供了可配置参数--housekeeping_interval,我们将其设为5s。global_housekeeping_interval参数已废弃。
2.4 External-Metrics-Apiserver设计及实现
External-metrics-apisever 是对接自研minitor监控系统hpa external类型指标的apiserver。其包含两部分:monitor指标采集(mysql 存储),external-metrics-adapter。external-metrics-adapter是按照前面2.2提及的custom-metrics-apiserver的开发方法,实现一套标准接口: github.com/kubernetes-incubator/custom-metrics-apiserver/pkg/ provider/interfaces.go
type CustomMetricsProvider interface {
   // GetMetricByName fetches a particular metric for a particular object.
   // The namespace will be empty if the metric is root-scoped.
   GetMetricByName(name types.NamespacedName, info CustomMetricInfo, metricSelector labels.Selector) (*custom_metrics.MetricValue, error)

   // GetMetricBySelector fetches a particular metric for a set of objects matching
   // the given label selector.  The namespace will be empty if the metric is root-scoped.
   GetMetricBySelector(namespace string, selector labels.Selector, info CustomMetricInfo, metricSelector labels.Selector) (*custom_metrics.MetricValueList, error)

   // ListAllMetrics provides a list of all available metrics at
   // the current time.  Note that this is not allowed to return
   // an error, so it is reccomended that implementors cache and
   // periodically update this list, instead of querying every time.
   ListAllMetrics() []CustomMetricInfo
}

// ExternalMetricsProvider is a source of external metrics.
// Metric is normally identified by a name and a set of labels/tags. It is up to a specific
// implementation how to translate metricSelector to a filter for metric values.
// Namespace can be used by the implemetation for metric identification, access control or ignored.
type ExternalMetricsProvider interface {
   GetExternalMetric(namespace string, metricSelector labels.Selector, info ExternalMetricInfo) (*external_metrics.ExternalMetricValueList, error)

   ListAllExternalMetrics() []ExternalMetricInfo
}

type MetricsProvider interface {
   CustomMetricsProvider
   ExternalMetricsProvider
}
其整体架构:

橘黄色部分是整个对接monitor监控hpa external metrics结构。执行逻辑:
3 Cron-HPA设计及实现
定时扩容Cron-HPA CRD Controller采用kube-builder方式开发,kube-builder CRD开发入门指引可参考github.com/kubernetes-…。
3.1 CRD设计
开发过crd controller的同学知道设计的yaml对应数据结构的存放目录,在此不赘述,只贴出yaml示例。
apiVersion: autoscaling.stke.com/v1beta1
kind: CronHorizontalPodAutoscaler
metadata:
  annotations:
    platform.stke/adjust-hpa-min: "false"
  creationTimestamp: 2019-12-04T03:40:41Z
  generation: 1
  name: cronhpa-sample
  namespace: default
  resourceVersion: "94982633"
  selfLink: /apis/autoscaling.stke.com/v1beta1/namespaces/default/cronhorizontalpodautoscalers/cronhpa-sample
  uid: d80e70ad-1647-11ea-bc27-5254002eeedd
spec:
  jobs:
  - name: scale-down
    schedule: 0 */7 * * * ?
    targetSize: 3
  - name: scale-up
    schedule: 0 */3 * * * ?
    targetSize: 3
  scaleTargetRef:
    apiVersion: extensions/v1beta1
    kind: Deployment
    name: cronhpa-nginx-deployment
status:
  conditions:
  - jobId: f0510daf-815f-4382-a99d-d264af3ba3ac
    lastProbeTime: 2019-12-18T15:00:00Z
    message: 'cron hpa job scale-down executed successfully. current scale (namespace:default;kind: Deployment;name: cronhpa-nginx-deployment) replicas:3, desired scale replicas:3,adjustType:[scale replicas]. time:2019-12-18 23:00:00, next:2019-12-18 23:07:00'
    name: scale-down
    schedule: 0 */7 * * * ?
    state: Succeed
  - jobId: 072043bc-e71d-4855-a23d-1607f1b6e6b6
    lastProbeTime: 2019-12-18T15:06:00Z
    message: 'cron hpa job scale-up executed successfully. current scale (namespace:
 default;kind: Deployment;name: cronhpa-nginx-deployment) replicas:3, desired
 scale replicas:3,adjustType:[scale replicas]. time:2019-12-18 23:06:00, next:2019-12-18 23:09:00'
    name: scale-up
    schedule: 0 */3 * * * ?
    state: Succeed
  scaleUpKeepWindow: true
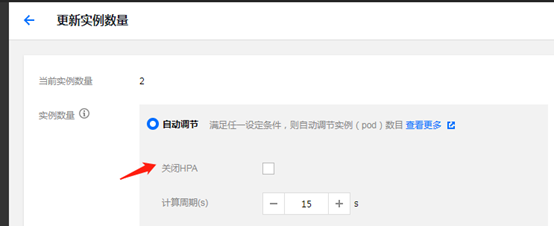
定时任务支持 ‘秒 分 时 日 月 周’ 格式,在此有个Status 状态很重要,就是scaleUpKeepWindow,在每个扩容任务的起始会设置为true,结束后设置为false. Cron-hpa有两种调节方式:直接调节scale对象的spec.Replicas和调节hpa spec. MinReplicas,通过Annotations["platform.stke/adjust-hpa-min"]指定;当调整hpa spec. MinReplicas时,hpa可以同时工作,这时在保证定时设置的最小副本数的前提小可以弹性伸缩,当调整spec.Replicas时,这时hpa不工作,意味着不管负载如何既不扩容也不缩容。
3.2 关键模块实现
Cron-hpa的本质实现是解释CRD对象中的job任务,由go-cron 去执行具体任务。Cron-hpa Controller对CRD进行增删改查的响应,包括job任务增删改,一旦有job 任务发生更新,就会重置任务为Submitted状态,初始状态也是Submitted。如任务名称有更新,那么会删除旧的job任务ID并新建。以kubebuilder 的Reconcile(reques reconcile.Request )为入口,主体流程如下:
Get Cronhpa object to CRUD

If ! Cronhpa Not Existed {
range Status.Conditons {
range Spec.Jobs {
  compare both to CRUD con-job}
}
}}
Job Run {
 If adjust hpa {
  get hpa object to update
} else{
  Get scale object to update
 }
}
Job Result Handle {
 If succ && scale-up job{
  Update cronhpa scaleUpKeepWindow to true
} else{
  Update cronhpa scaleUpKeepWindow to false
 }
}
4 HPA minReplicas自动调整方案
为提升集群资源利用率,根据历史负载自动调整Hpa 最小副本数minRplicas。 调整方案: 1 根据历史7天负载峰值数据取加权平均值,小于设定的目标值则调整,计算原理同hpa 2 那种忽略负载但必须保证一定数量的副本则需加白名单,比如zookeeper高可用 3 检测定时CronHpa的任务,在定时任务期间不进行低负载告警及调整,不需加白名单
5 使用介绍
此章节介绍前端适配HPA/CRON实际使用介绍
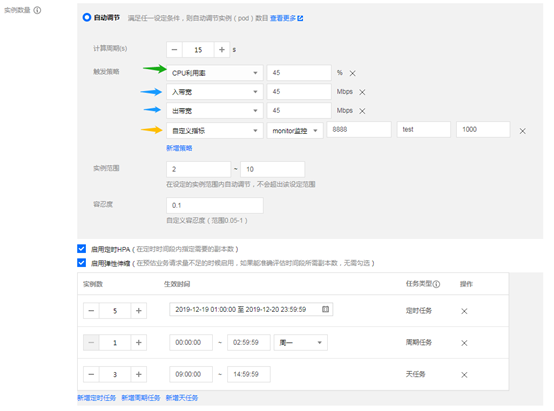
5.1 HPA使用介绍
在进行部署时的第二个页面中的实例数量栏目,下面用示例介绍。
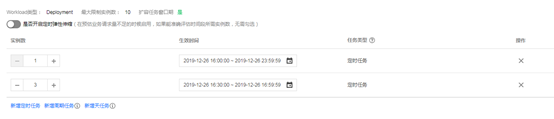
5.2 Cron-HPA使用介绍
Cron-HPA定时任务后台是支持linux cron job任务的所有策略,
6 小结
弹性伸缩HPA是云计算的重要特性,本文在k8s原生HPA的基础做了增强功能及适配业务需求自定义特性的设计实现。当然这里面还有可优化之处如: · 2.4小节中的monitor external-metrics-apiserver:首先,已指出还存在性能瓶颈;其次,若用于大规模集群的高并发采集,应该采用第三方独立消息队列组件,实现多对多的生产者(采集指标入队列)消费者(取指标入库mysql),可以用k8s的微服务方式去设计。
