<!DOCTYPE html>

<html lang="en">

<head>

    <meta charset="UTF-8">

    <title>环状图</title>

    <style>
        body {

            margin: 0;

            padding: 50px 0;

            background-color: #444;

        }

        ul,
        li {

            list-style: none;

            margin: 0;

            padding: 0;

        }

        ul li {
            float: left;

            width: 33%;

            text-align: center;
        }
    </style>

</head>

<body>

    <div class="box">

            <ul>

                    <li>

                            <canvas id="one" width="200" height="200"></canvas>

                        </li>

                    <li>

                            <canvas id="two" width="200" height="200"></canvas>

                        </li>

                    <li>

                            <canvas id="three" width="200" height="200"></canvas>

                        </li>

                </ul>

    </div>

</body>

<script>

    function drawCircle(_options) {

        var options = _options || {};    //获取或定义options对象;

        options.angle = options.angle || 1;    //定义默认角度1为360度(角度范围 0-1);

        options.color = options.color || '#fff';    //定义默认颜色(包括字体和边框颜色);

        options.lineWidth = options.lineWidth || 10;    //定义默认圆描边的宽度;

        options.lineCap = options.lineCap || 'square';    //定义描边的样式,默认为直角边,round 为圆角

        var oBoxOne = document.getElementById(options.id);

        var sCenter = oBoxOne.width / 2;    //获取canvas元素的中心点;

        var ctx = oBoxOne.getContext('2d');

        var nBegin = Math.PI / 2;    //定义起始角度;

        var nEnd = Math.PI * 2;    //定义结束角度;

        var grd = ctx.createLinearGradient(0, 0, oBoxOne.width, 0);    //grd定义为描边渐变样式;

        grd.addColorStop(0, 'red');

        grd.addColorStop(0.5, 'yellow');

        grd.addColorStop(1, 'green');

        ctx.textAlign = 'center';    //定义字体居中;

        ctx.font = 'normal normal bold 20px Arial';    //定义字体加粗大小字体样式;

        ctx.fillStyle = options.color == 'grd' ? grd : options.color;    //判断文字填充样式为颜色,还是渐变色;

        ctx.fillText((options.angle * 100) + '%', sCenter, sCenter);    //设置填充文字;

        /*ctx.strokeStyle = grd;    //设置描边样式为渐变色;

        ctx.strokeText((options.angle * 100) + '%', sCenter, sCenter);    //设置描边文字(即镂空文字);*/

        ctx.lineCap = options.lineCap;

        ctx.strokeStyle = options.color == 'grd' ? grd : options.color;

        ctx.lineWidth = options.lineWidth;

        ctx.beginPath();    //设置起始路径,这段绘制360度背景;

        ctx.strokeStyle = '#D8D8D8';

        ctx.arc(sCenter, sCenter, (sCenter - options.lineWidth), -nBegin, nEnd, false);

        ctx.stroke();

        var imd = ctx.getImageData(0, 0, 240, 240);

        function draw(current) {    //该函数实现角度绘制;

            ctx.putImageData(imd, 0, 0);

            ctx.beginPath();

            ctx.strokeStyle = options.color == 'grd' ? grd : options.color;

            ctx.arc(sCenter, sCenter, (sCenter - options.lineWidth), -nBegin, (nEnd * current) - nBegin, false);

            ctx.stroke();

        }

        var t = 0;

        var timer = null;

        function loadCanvas(angle) {    //该函数循环绘制指定角度,实现加载动画;

            timer = setInterval(function () {

                if (t > angle) {

                    draw(options.angle);

                    clearInterval(timer);

                } else {

                    draw(t);

                    t += 0.02;

                }

            }, 20);

        }

        loadCanvas(options.angle);    //载入百度比角度  0-1 范围;

        timer = null;

    }

    drawCircle({

        id: 'one',

        color: '#0000ff',

        angle: 0.5,

        lineWidth: 5

    });

    drawCircle({

        id: 'two',

        angle: 0.75,

        color: '#ff0000',

        lineWidth: 12

    });

    drawCircle({

        id: 'three',

        angle: 1,

        lineWidth: 15,

        color: 'grd'

    });

</script>

</html>
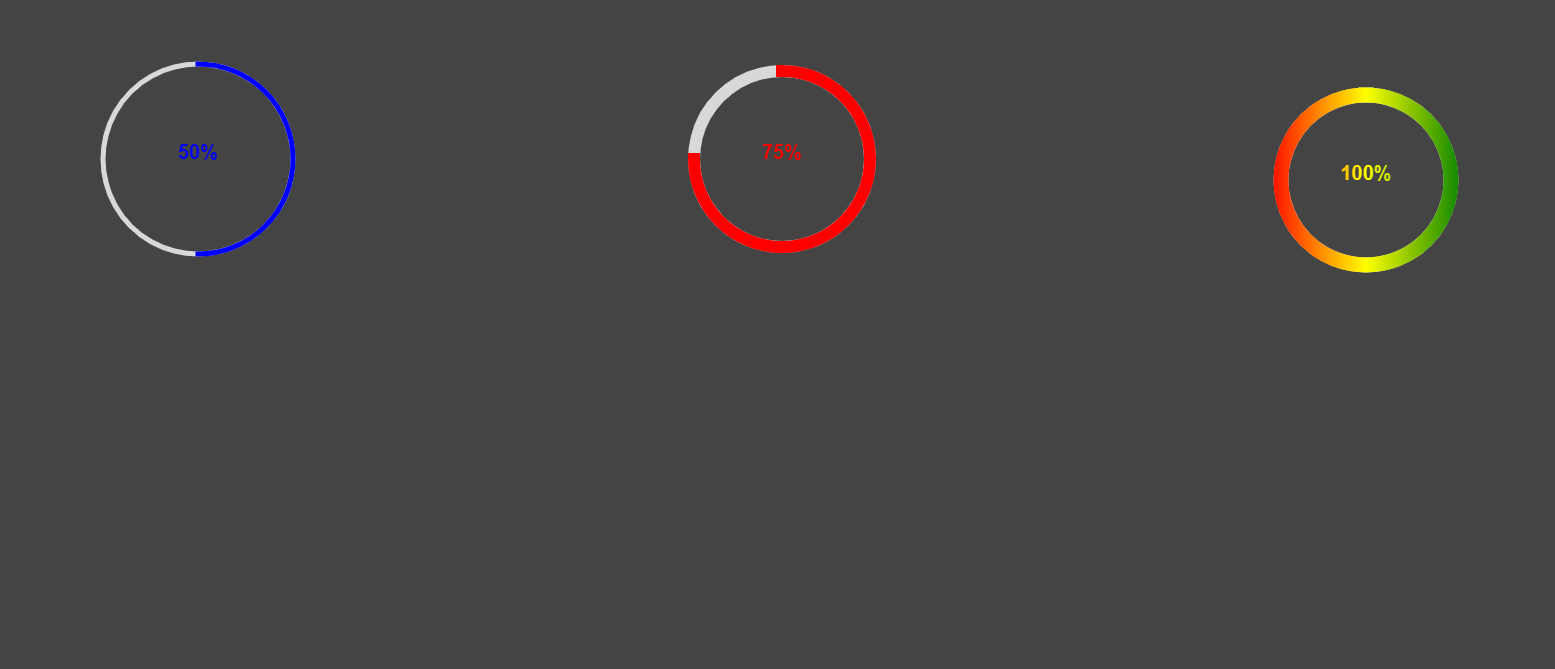
效果图