

感谢参考原文-bjbsair.com/2020-04-01/…
1、安装和配置redis-exporter
1.1 使用helm安装redis-exporter
在本方案的redis-exporter在Kubernetes集群中进行部署,并假设在kube-public命名空间下已经部署了redis,对外暴露的服务名称为redis-service。redis-exporter负责从redis中获取指标数据,并将这些数据传递给Prometheus。
$ helm install --name prom-exporter --set "redisAddress=redis://redis-service:6379" stable/prometheus-redis-exporter --namespace=kube-public
redis-exporter部署的主要参数和说明:
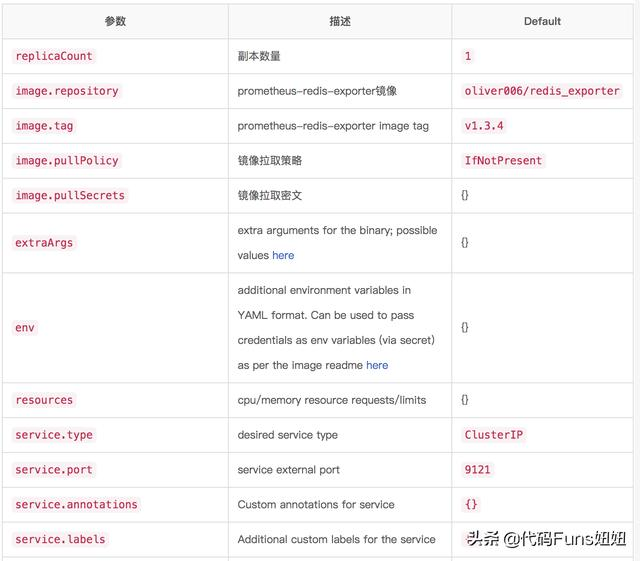
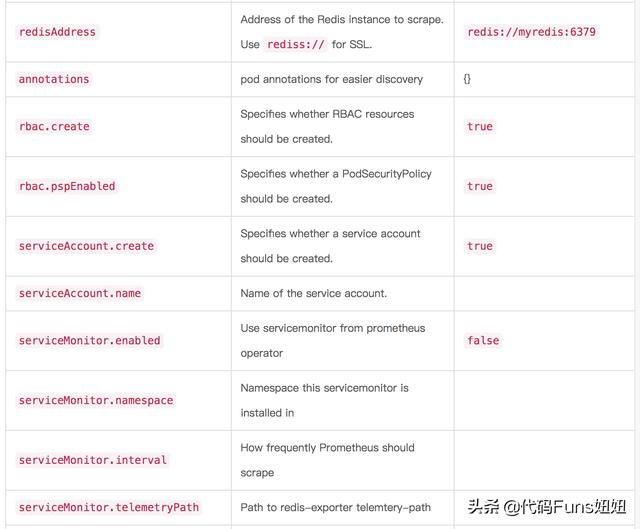
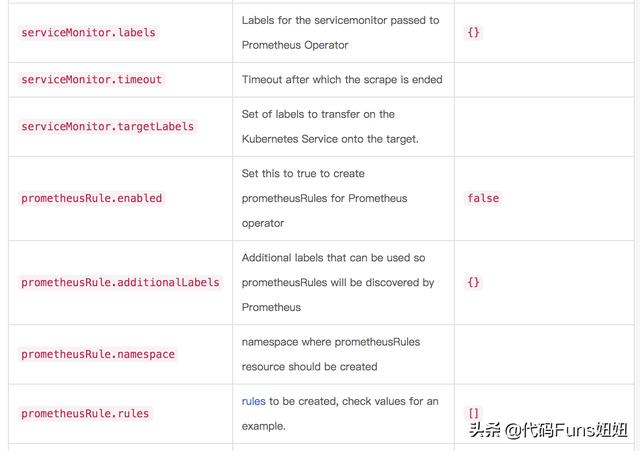
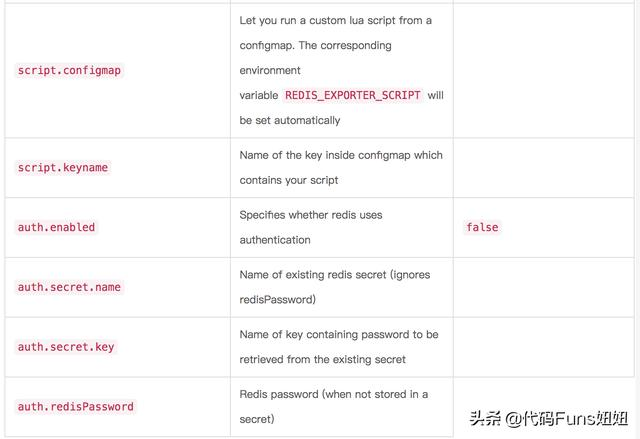
1.2 对外暴露redis-exporter
通过下面的命令,将集中部署的redis-exporter暴露给集群外的用户访问。
$ kubectl expose deployment prom-exporter-prometheus-redis-exporter --type=NodePort --namespace=kube-public
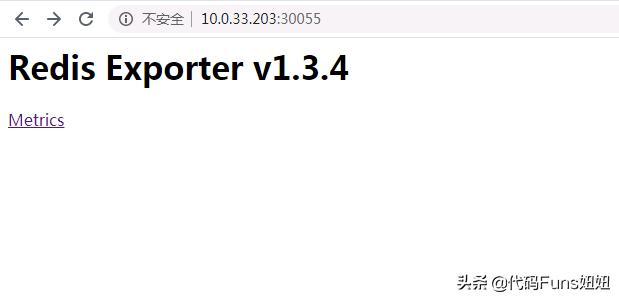
1.3 查看redis指标数据
在浏览器中,访问redis-exporter,能够看到所要监控的redis指标。
# HELP go_gc_duration_seconds A summary of the GC invocation durations.
# TYPE go_gc_duration_seconds summary
go_gc_duration_seconds{quantile=”0″} 0
go_gc_duration_seconds{quantile=”0.25″} 0
go_gc_duration_seconds{quantile=”0.5″} 0
go_gc_duration_seconds{quantile=”0.75″} 0
go_gc_duration_seconds{quantile=”1″} 0
go_gc_duration_seconds_sum 0
go_gc_duration_seconds_count 0
# HELP go_goroutines Number of goroutines that currently exist.
# TYPE go_goroutines gauge
go_goroutines 8
# HELP go_info Information about the Go environment.
# TYPE go_info gauge
go_info{version=”go1.13.4″} 1
# HELP go_memstats_alloc_bytes Number of bytes allocated and still in use.
# TYPE go_memstats_alloc_bytes gauge
go_memstats_alloc_bytes 1.198456e+06
# HELP go_memstats_alloc_bytes_total Total number of bytes allocated, even if freed.
# TYPE go_memstats_alloc_bytes_total counter
go_memstats_alloc_bytes_total 1.198456e+06
# HELP go_memstats_buck_hash_sys_bytes Number of bytes used by the profiling bucket hash table.
# TYPE go_memstats_buck_hash_sys_bytes gauge
go_memstats_buck_hash_sys_bytes 1.442979e+06
# HELP go_memstats_frees_total Total number of frees.
# TYPE go_memstats_frees_total counter
go_memstats_frees_total 248
# HELP go_memstats_gc_cpu_fraction The fraction of this program’s available CPU time used by the GC since the program started.
# TYPE go_memstats_gc_cpu_fraction gauge
go_memstats_gc_cpu_fraction 0
# HELP go_memstats_gc_sys_bytes Number of bytes used for garbage collection system metadata.
# TYPE go_memstats_gc_sys_bytes gauge
go_memstats_gc_sys_bytes 2.240512e+06
# HELP go_memstats_heap_alloc_bytes Number of heap bytes allocated and still in use.
# TYPE go_memstats_heap_alloc_bytes gauge
go_memstats_heap_alloc_bytes 1.198456e+06
# HELP go_memstats_heap_idle_bytes Number of heap bytes waiting to be used.
# TYPE go_memstats_heap_idle_bytes gauge
go_memstats_heap_idle_bytes 6.4086016e+07
# HELP go_memstats_heap_inuse_bytes Number of heap bytes that are in use.
# TYPE go_memstats_heap_inuse_bytes gauge
go_memstats_heap_inuse_bytes 2.465792e+06
# HELP go_memstats_heap_objects Number of allocated objects.
# TYPE go_memstats_heap_objects gauge
go_memstats_heap_objects 3334
# HELP go_memstats_heap_released_bytes Number of heap bytes released to OS.
# TYPE go_memstats_heap_released_bytes gauge
go_memstats_heap_released_bytes 6.4053248e+07
# HELP go_memstats_heap_sys_bytes Number of heap bytes obtained from system.
# TYPE go_memstats_heap_sys_bytes gauge
go_memstats_heap_sys_bytes 6.6551808e+07
# HELP go_memstats_last_gc_time_seconds Number of seconds since 1970 of last garbage collection.
# TYPE go_memstats_last_gc_time_seconds gauge
go_memstats_last_gc_time_seconds 0
# HELP go_memstats_lookups_total Total number of pointer lookups.
# TYPE go_memstats_lookups_total counter
go_memstats_lookups_total 0
# HELP go_memstats_mallocs_total Total number of mallocs.
# TYPE go_memstats_mallocs_total counter
go_memstats_mallocs_total 3582
# HELP go_memstats_mcache_inuse_bytes Number of bytes in use by mcache structures.
# TYPE go_memstats_mcache_inuse_bytes gauge
go_memstats_mcache_inuse_bytes 83328
# HELP go_memstats_mcache_sys_bytes Number of bytes used for mcache structures obtained from system.
# TYPE go_memstats_mcache_sys_bytes gauge
go_memstats_mcache_sys_bytes 98304
# HELP go_memstats_mspan_inuse_bytes Number of bytes in use by mspan structures.
# TYPE go_memstats_mspan_inuse_bytes gauge
go_memstats_mspan_inuse_bytes 27608
# HELP go_memstats_mspan_sys_bytes Number of bytes used for mspan structures obtained from system.
# TYPE go_memstats_mspan_sys_bytes gauge
go_memstats_mspan_sys_bytes 32768
# HELP go_memstats_next_gc_bytes Number of heap bytes when next garbage collection will take place.
# TYPE go_memstats_next_gc_bytes gauge
go_memstats_next_gc_bytes 4.473924e+06
# HELP go_memstats_other_sys_bytes Number of bytes used for other system allocations.
# TYPE go_memstats_other_sys_bytes gauge
go_memstats_other_sys_bytes 707669
# HELP go_memstats_stack_inuse_bytes Number of bytes in use by the stack allocator.
# TYPE go_memstats_stack_inuse_bytes gauge
go_memstats_stack_inuse_bytes 557056
# HELP go_memstats_stack_sys_bytes Number of bytes obtained from system for stack allocator.
# TYPE go_memstats_stack_sys_bytes gauge
go_memstats_stack_sys_bytes 557056
# HELP go_memstats_sys_bytes Number of bytes obtained from system.
# TYPE go_memstats_sys_bytes gauge
go_memstats_sys_bytes 7.1631096e+07
# HELP go_threads Number of OS threads created.
# TYPE go_threads gauge
go_threads 7
# HELP process_cpu_seconds_total Total user and system CPU time spent in seconds.
# TYPE process_cpu_seconds_total counter
process_cpu_seconds_total 0.07
# HELP process_max_fds Maximum number of open file descriptors.
# TYPE process_max_fds gauge
process_max_fds 65536
# HELP process_open_fds Number of open file descriptors.
# TYPE process_open_fds gauge
process_open_fds 9
# HELP process_resident_memory_bytes Resident memory size in bytes.
# TYPE process_resident_memory_bytes gauge
process_resident_memory_bytes 4.58752e+06
# HELP process_start_time_seconds Start time of the process since unix epoch in seconds.
# TYPE process_start_time_seconds gauge
process_start_time_seconds 1.58528265239e+09
# HELP process_virtual_memory_bytes Virtual memory size in bytes.
# TYPE process_virtual_memory_bytes gauge
process_virtual_memory_bytes 1.14233344e+08
# HELP process_virtual_memory_max_bytes Maximum amount of virtual memory available in bytes.
# TYPE process_virtual_memory_max_bytes gauge
process_virtual_memory_max_bytes -1
# HELP redis_exporter_build_info redis exporter build_info
# TYPE redis_exporter_build_info gauge
redis_exporter_build_info{build_date=”2019-11-15-19:32:19″,commit_sha=”e15c7d22b9151c3681c60b5df5cd552584bef10d”,golang_version=”go1.13.4″,version=”v1.3.4″} 1
# HELP redis_exporter_last_scrape_duration_seconds exporter_last_scrape_duration_seconds metric
# TYPE redis_exporter_last_scrape_duration_seconds gauge
redis_exporter_last_scrape_duration_seconds 0.019919049
# HELP redis_exporter_last_scrape_error The last scrape error status.
# TYPE redis_exporter_last_scrape_error gauge
redis_exporter_last_scrape_error{err=”NOAUTH Authentication required.”} 1
# HELP redis_exporter_scrape_duration_seconds Duration of scrape by the exporter
# TYPE redis_exporter_scrape_duration_seconds summary
redis_exporter_scrape_duration_seconds{quantile=”0.5″} NaN
redis_exporter_scrape_duration_seconds{quantile=”0.9″} NaN
redis_exporter_scrape_duration_seconds{quantile=”0.99″} NaN
redis_exporter_scrape_duration_seconds_sum 0
redis_exporter_scrape_duration_seconds_count 0
# HELP redis_exporter_scrapes_total Current total redis scrapes.
# TYPE redis_exporter_scrapes_total counter
redis_exporter_scrapes_total 1
# HELP redis_target_scrape_request_errors_total Errors in requests to the exporter
# TYPE redis_target_scrape_request_errors_total counter
redis_target_scrape_request_errors_total 0
# HELP redis_up Information about the Redis instance
# TYPE redis_up gauge
redis_up 0
2、Prometheus监控
2.1 配置Prometheus
在Prometheus的配置文件(Prometheus.yaml)中,添加红色字体部分的内容。
global:
scrape_interval: 15s # Set the scrape interval to every 15 seconds. Default is every 1 minute.
evaluation_interval: 15s # Evaluate rules every 15 seconds. The default is every 1 minute.
# scrape_timeout is set to the global default (10s).

# Alertmanager configuration
alerting:
alertmanagers:
– static_configs:
– targets:
# – alertmanager:9093

# Load rules once and periodically evaluate them according to the global ‘evaluation_interval’.
rule_files:
# – “first_rules.yml”
# – “second_rules.yml”

# A scrape configuration containing exactly one endpoint to scrape:
# Here it’s Prometheus itself.
scrape_configs:
# The job name is added as a label `job=<job_name>` to any timeseries scraped from this config.
– job_name: ‘prometheus’

# metrics_path defaults to ‘/metrics’
# scheme defaults to ‘http’.

static_configs:
– targets: [‘localhost:9090’]

# 配置从redis-exporter中获取数据,目标地址为:redis-exporter-np:9121

– job_name: ‘redis’
static_configs:
– targets: [‘redis-exporter-np:9121’]
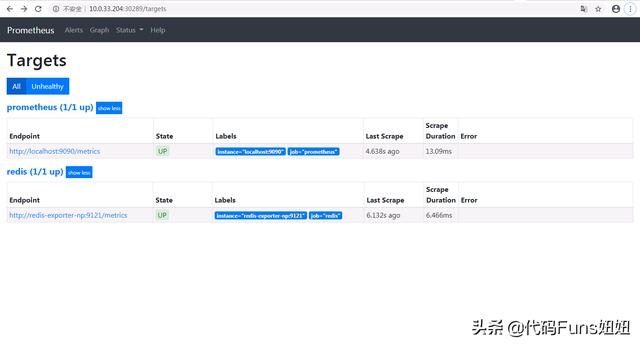
2.2 配置验证
在浏览器的地址栏访问http://{prometheus}/targets,将会看到新配置的redis。
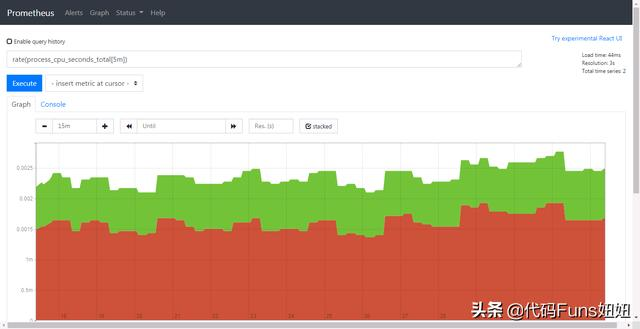
2.3 查看指标情况
在浏览器的地址栏访问http://{prometheus}/graph,在此处执行:rate(process_cpu_seconds_total[10m])
1、安装和配置redis-exporter
1.1 使用helm安装redis-exporter
在本方案的redis-exporter在Kubernetes集群中进行部署,并假设在kube-public命名空间下已经部署了redis,对外暴露的服务名称为redis-service。redis-exporter负责从redis中获取指标数据,并将这些数据传递给Prometheus。
$ helm install --name prom-exporter --set "redisAddress=redis://redis-service:6379" stable/prometheus-redis-exporter --namespace=kube-public
redis-exporter部署的主要参数和说明:
1.2 对外暴露redis-exporter
通过下面的命令,将集中部署的redis-exporter暴露给集群外的用户访问。
$ kubectl expose deployment prom-exporter-prometheus-redis-exporter --type=NodePort --namespace=kube-public
1.3 查看redis指标数据
在浏览器中,访问redis-exporter,能够看到所要监控的redis指标。
# HELP go_gc_duration_seconds A summary of the GC invocation durations.
# TYPE go_gc_duration_seconds summary
go_gc_duration_seconds{quantile=”0″} 0
go_gc_duration_seconds{quantile=”0.25″} 0
go_gc_duration_seconds{quantile=”0.5″} 0
go_gc_duration_seconds{quantile=”0.75″} 0
go_gc_duration_seconds{quantile=”1″} 0
go_gc_duration_seconds_sum 0
go_gc_duration_seconds_count 0
# HELP go_goroutines Number of goroutines that currently exist.
# TYPE go_goroutines gauge
go_goroutines 8
# HELP go_info Information about the Go environment.
# TYPE go_info gauge
go_info{version=”go1.13.4″} 1
# HELP go_memstats_alloc_bytes Number of bytes allocated and still in use.
# TYPE go_memstats_alloc_bytes gauge
go_memstats_alloc_bytes 1.198456e+06
# HELP go_memstats_alloc_bytes_total Total number of bytes allocated, even if freed.
# TYPE go_memstats_alloc_bytes_total counter
go_memstats_alloc_bytes_total 1.198456e+06
# HELP go_memstats_buck_hash_sys_bytes Number of bytes used by the profiling bucket hash table.
# TYPE go_memstats_buck_hash_sys_bytes gauge
go_memstats_buck_hash_sys_bytes 1.442979e+06
# HELP go_memstats_frees_total Total number of frees.
# TYPE go_memstats_frees_total counter
go_memstats_frees_total 248
# HELP go_memstats_gc_cpu_fraction The fraction of this program’s available CPU time used by the GC since the program started.
# TYPE go_memstats_gc_cpu_fraction gauge
go_memstats_gc_cpu_fraction 0
# HELP go_memstats_gc_sys_bytes Number of bytes used for garbage collection system metadata.
# TYPE go_memstats_gc_sys_bytes gauge
go_memstats_gc_sys_bytes 2.240512e+06
# HELP go_memstats_heap_alloc_bytes Number of heap bytes allocated and still in use.
# TYPE go_memstats_heap_alloc_bytes gauge
go_memstats_heap_alloc_bytes 1.198456e+06
# HELP go_memstats_heap_idle_bytes Number of heap bytes waiting to be used.
# TYPE go_memstats_heap_idle_bytes gauge
go_memstats_heap_idle_bytes 6.4086016e+07
# HELP go_memstats_heap_inuse_bytes Number of heap bytes that are in use.
# TYPE go_memstats_heap_inuse_bytes gauge
go_memstats_heap_inuse_bytes 2.465792e+06
# HELP go_memstats_heap_objects Number of allocated objects.
# TYPE go_memstats_heap_objects gauge
go_memstats_heap_objects 3334
# HELP go_memstats_heap_released_bytes Number of heap bytes released to OS.
# TYPE go_memstats_heap_released_bytes gauge
go_memstats_heap_released_bytes 6.4053248e+07
# HELP go_memstats_heap_sys_bytes Number of heap bytes obtained from system.
# TYPE go_memstats_heap_sys_bytes gauge
go_memstats_heap_sys_bytes 6.6551808e+07
# HELP go_memstats_last_gc_time_seconds Number of seconds since 1970 of last garbage collection.
# TYPE go_memstats_last_gc_time_seconds gauge
go_memstats_last_gc_time_seconds 0
# HELP go_memstats_lookups_total Total number of pointer lookups.
# TYPE go_memstats_lookups_total counter
go_memstats_lookups_total 0
# HELP go_memstats_mallocs_total Total number of mallocs.
# TYPE go_memstats_mallocs_total counter
go_memstats_mallocs_total 3582
# HELP go_memstats_mcache_inuse_bytes Number of bytes in use by mcache structures.
# TYPE go_memstats_mcache_inuse_bytes gauge
go_memstats_mcache_inuse_bytes 83328
# HELP go_memstats_mcache_sys_bytes Number of bytes used for mcache structures obtained from system.
# TYPE go_memstats_mcache_sys_bytes gauge
go_memstats_mcache_sys_bytes 98304
# HELP go_memstats_mspan_inuse_bytes Number of bytes in use by mspan structures.
# TYPE go_memstats_mspan_inuse_bytes gauge
go_memstats_mspan_inuse_bytes 27608
# HELP go_memstats_mspan_sys_bytes Number of bytes used for mspan structures obtained from system.
# TYPE go_memstats_mspan_sys_bytes gauge
go_memstats_mspan_sys_bytes 32768
# HELP go_memstats_next_gc_bytes Number of heap bytes when next garbage collection will take place.
# TYPE go_memstats_next_gc_bytes gauge
go_memstats_next_gc_bytes 4.473924e+06
# HELP go_memstats_other_sys_bytes Number of bytes used for other system allocations.
# TYPE go_memstats_other_sys_bytes gauge
go_memstats_other_sys_bytes 707669
# HELP go_memstats_stack_inuse_bytes Number of bytes in use by the stack allocator.
# TYPE go_memstats_stack_inuse_bytes gauge
go_memstats_stack_inuse_bytes 557056
# HELP go_memstats_stack_sys_bytes Number of bytes obtained from system for stack allocator.
# TYPE go_memstats_stack_sys_bytes gauge
go_memstats_stack_sys_bytes 557056
# HELP go_memstats_sys_bytes Number of bytes obtained from system.
# TYPE go_memstats_sys_bytes gauge
go_memstats_sys_bytes 7.1631096e+07
# HELP go_threads Number of OS threads created.
# TYPE go_threads gauge
go_threads 7
# HELP process_cpu_seconds_total Total user and system CPU time spent in seconds.
# TYPE process_cpu_seconds_total counter
process_cpu_seconds_total 0.07
# HELP process_max_fds Maximum number of open file descriptors.
# TYPE process_max_fds gauge
process_max_fds 65536
# HELP process_open_fds Number of open file descriptors.
# TYPE process_open_fds gauge
process_open_fds 9
# HELP process_resident_memory_bytes Resident memory size in bytes.
# TYPE process_resident_memory_bytes gauge
process_resident_memory_bytes 4.58752e+06
# HELP process_start_time_seconds Start time of the process since unix epoch in seconds.
# TYPE process_start_time_seconds gauge
process_start_time_seconds 1.58528265239e+09
# HELP process_virtual_memory_bytes Virtual memory size in bytes.
# TYPE process_virtual_memory_bytes gauge
process_virtual_memory_bytes 1.14233344e+08
# HELP process_virtual_memory_max_bytes Maximum amount of virtual memory available in bytes.
# TYPE process_virtual_memory_max_bytes gauge
process_virtual_memory_max_bytes -1
# HELP redis_exporter_build_info redis exporter build_info
# TYPE redis_exporter_build_info gauge
redis_exporter_build_info{build_date=”2019-11-15-19:32:19″,commit_sha=”e15c7d22b9151c3681c60b5df5cd552584bef10d”,golang_version=”go1.13.4″,version=”v1.3.4″} 1
# HELP redis_exporter_last_scrape_duration_seconds exporter_last_scrape_duration_seconds metric
# TYPE redis_exporter_last_scrape_duration_seconds gauge
redis_exporter_last_scrape_duration_seconds 0.019919049
# HELP redis_exporter_last_scrape_error The last scrape error status.
# TYPE redis_exporter_last_scrape_error gauge
redis_exporter_last_scrape_error{err=”NOAUTH Authentication required.”} 1
# HELP redis_exporter_scrape_duration_seconds Duration of scrape by the exporter
# TYPE redis_exporter_scrape_duration_seconds summary
redis_exporter_scrape_duration_seconds{quantile=”0.5″} NaN
redis_exporter_scrape_duration_seconds{quantile=”0.9″} NaN
redis_exporter_scrape_duration_seconds{quantile=”0.99″} NaN
redis_exporter_scrape_duration_seconds_sum 0
redis_exporter_scrape_duration_seconds_count 0
# HELP redis_exporter_scrapes_total Current total redis scrapes.
# TYPE redis_exporter_scrapes_total counter
redis_exporter_scrapes_total 1
# HELP redis_target_scrape_request_errors_total Errors in requests to the exporter
# TYPE redis_target_scrape_request_errors_total counter
redis_target_scrape_request_errors_total 0
# HELP redis_up Information about the Redis instance
# TYPE redis_up gauge
redis_up 0
2、Prometheus监控
2.1 配置Prometheus
在Prometheus的配置文件(Prometheus.yaml)中,添加红色字体部分的内容。
global:
scrape_interval: 15s # Set the scrape interval to every 15 seconds. Default is every 1 minute.
evaluation_interval: 15s # Evaluate rules every 15 seconds. The default is every 1 minute.
# scrape_timeout is set to the global default (10s).

# Alertmanager configuration
alerting:
alertmanagers:
– static_configs:
– targets:
# – alertmanager:9093

# Load rules once and periodically evaluate them according to the global ‘evaluation_interval’.
rule_files:
# – “first_rules.yml”
# – “second_rules.yml”

# A scrape configuration containing exactly one endpoint to scrape:
# Here it’s Prometheus itself.
scrape_configs:
# The job name is added as a label `job=<job_name>` to any timeseries scraped from this config.
– job_name: ‘prometheus’

# metrics_path defaults to ‘/metrics’
# scheme defaults to ‘http’.

static_configs:
– targets: [‘localhost:9090’]

# 配置从redis-exporter中获取数据,目标地址为:redis-exporter-np:9121

– job_name: ‘redis’
static_configs:
– targets: [‘redis-exporter-np:9121’]
2.2 配置验证
在浏览器的地址栏访问http://{prometheus}/targets,将会看到新配置的redis。
2.3 查看指标情况
在浏览器的地址栏访问http://{prometheus}/graph,在此处执行:rate(process_cpu_seconds_total[10m])
