

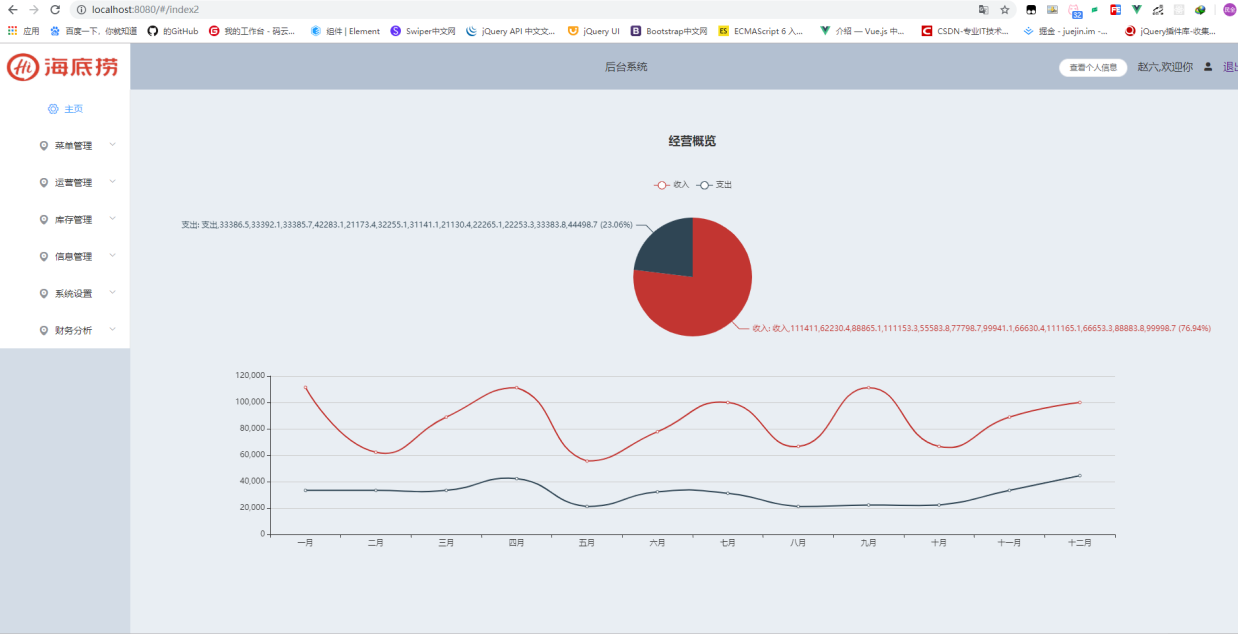
效果如下
完整代码如下 需在main.js中配置import echarts from 'echarts' //引入echarts 、 Vue.prototype.$echarts = echarts //引入组件
    <template>
      <div>
      <h2>经营概览</h2>
        <div id="chart_example">
         </div>
      </div>
    </template>

    <script>
 import echarts from 'echarts'
 export default {
    data() {
  return {}
  },
  mounted() {
  let this_ = this;
  let myChart = echarts.init(document.getElementById('chart_example'));
  let option = {
    legend: {},
    tooltip: {
        trigger: 'axis',
        showContent: false
    },
    dataset: {
        source: [
            ['product', '一月', '二月', '三月', '四月', '五月', '六月', '七月', '八月', '九月', '十月',     '十一月', '十二月'],
            ['收入', 111411, 62230.4, 88865.1, 111153.3, 55583.8, 77798.7, 99941.1, 66630.4, 111165.1, 66653.3, 88883.8, 99998.7],
            ['支出', 33386.5, 33392.1, 33385.7, 42283.1, 21173.4, 32255.1, 31141.1, 21130.4, 22265.1, 22253.3, 33383.8, 44498.7],
        ]
    },
    xAxis: {type: 'category'},
    yAxis: {gridIndex: 0},
    grid: {top: '50%'},
    series: [
        {type: 'line', smooth: true, seriesLayoutBy: 'row'},
        {type: 'line', smooth: true, seriesLayoutBy: 'row'},

        {
            type: 'pie',
            id: 'pie',
            radius: '30%',
            center: ['50%', '25%'],
            label: {
                formatter: '{b}: {@2012} ({d}%)'
            },
        }
    ]
  };

 myChart.on('updateAxisPointer', function (event) {
    var xAxisInfo = event.axesInfo[0];
    if (xAxisInfo) {
        var dimension = xAxisInfo.value + 1;
        myChart.setOption({
            series: {
                id: 'pie',
                label: {
                    formatter: '{b}: {@[' + dimension + ']} ({d}%)'
                },
                encode: {
                    value: dimension,
                    tooltip: dimension
                }
            }
        });
    }
});

  myChart.setOption(option);

  window.addEventListener('resize',function() {myChart.resize()});
},
 methods: {},
 watch: {},
   created() {

    }
  }
    </script>
    <style scoped>
  h2{
   text-align: center;
    padding: 30px;
   font-size: 18px;
  }
  #chart_example{
  width: 1600px;
   height: 600px;
   margin: 0 auto;
  }
</style>
