

version: ‘3.6’
services:
prometheus:
image: prom/prometheus:v2.14.0
volumes:
— ./prometheus/:/etc/prometheus/
command:
— ‘ — config.file=/etc/prometheus/prometheus.yml’
ports:
— 9090:9090
grafana:
image: grafana/grafana:6.5.2
ports:
— 3060:3000
global:
scrape_interval: 15s
evaluation_interval: 15s
rule_files:
# — “first.rules”
# — “second.rules”
scrape_configs:
— job_name: monitoring
static_configs:
— targets:
— host.docker.internal
$ docker-compose -f docker-compose.monitoring.yml up -d
pip install django-prometheus
BASE_INSTALLED_APPS = [
...
“django_prometheus”,
]
MIDDLEWARE = [
“django_prometheus.middleware.PrometheusBeforeMiddleware”,
...
“django_prometheus.middleware.PrometheusAfterMiddleware”,
]
url(“”, include(“django_prometheus.urls”)),
-
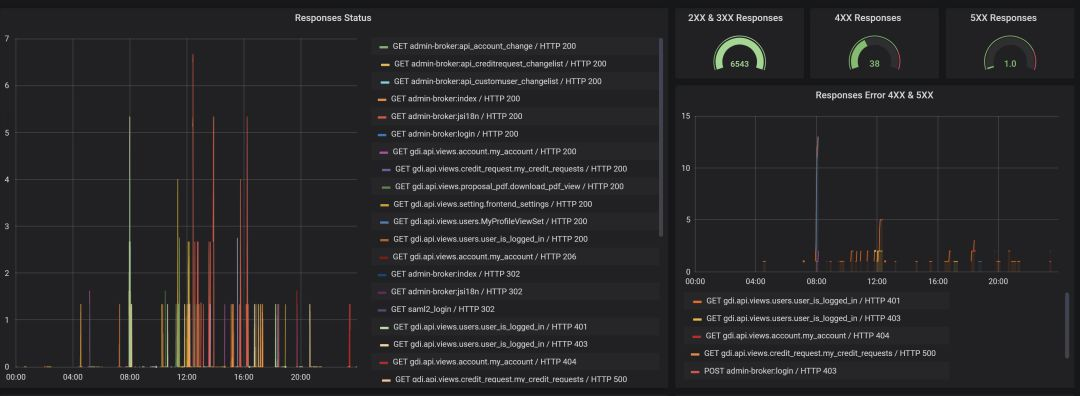
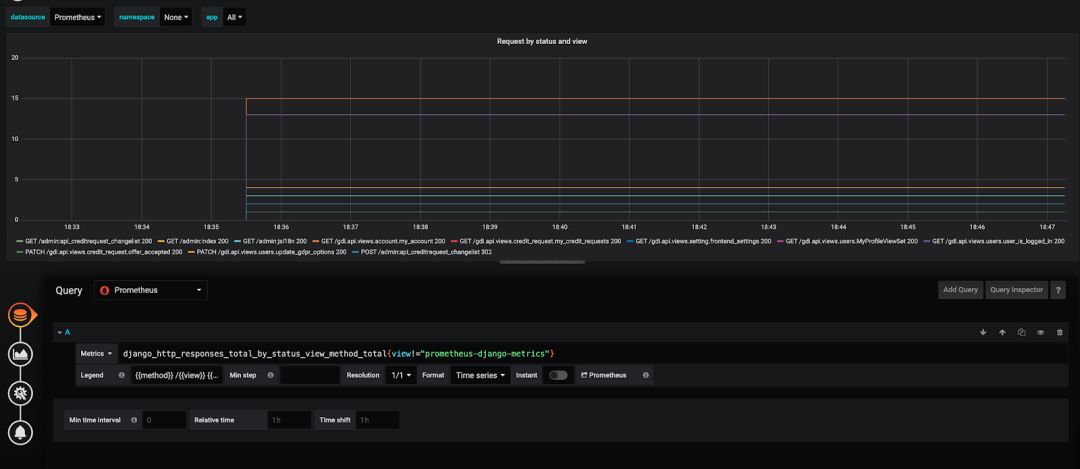
点击graph title,然后点击“Edit”。
-
在“Metrics”tab页,选择你的Prometheus数据源(页面右下角)。
-
在“Query”一栏,输入任何的Prometheus查询表达式,并且使用“Metric”选项去完成补全。
你已经注意到,我们已经在本地把我们的Grafana和Prometheus跑起来了。一旦你做到这点,你也准备好用你自己的方式去部署你的Grafana和Prometheus Docker镜像[3]。 我希望这10分钟的教程可以帮到你,让你方便、快速地使用Prometheus和Grafana去监控一个Django应用。 相关链接:
-
https://hub.docker.com/r/grafana/grafana
-
https://github.com/korfuri/django-prometheus/
-
https://www.katacoda.com/courses/docker/deploying-first-container