

示例代码请访问:github.com/wenjianzhan…
准备工作
- 安装 graphviz
- brew install graphviz
- 将
PATH
- Mac OS:在 .bash_profile 中修改路径
- 安装 go-torch
- go get github.com/uber/go-torch
- 下载并复制 flamegraph.pl (github.com/brendangreg…) 至 $GOPATH/bin 路径下
- 将
通过文件方式输出Profile
- 灵活性高,属用语特定代码段的分析
- 通过手动调用 runtime/pprof 的API
- API 相关文档 studygolang.com/static/pkgd…
- go tool pprof [binary] [binary.prof]
flamegraph.pl 下载下来 是需要给他是这一下执行权限
chmod +x flamegraph.pl
示例代码 prof.go
package main

import (
	"log"
	"math/rand"
	"os"
	"runtime/pprof"
	"time"
)

const (
	col = 10000
	row = 10000
)

func fillMatrix(m *[row][col]int) {
	s := rand.New(rand.NewSource(time.Now().UnixNano()))

	for i := 0; i < row; i++ {
		for j := 0; j < col; j++ {
			m[i][j] = s.Intn(100000)
		}
	}
}

func calculate(m *[row][col]int) {
	for i := 0; i < row; i++ {
		tmp := 0
		for j := 0; j < col; j++ {
			tmp += m[i][j]
		}
	}
}

func main() {
	//创建输出文件
	f, err := os.Create("cpu.prof")
	if err != nil {
		log.Fatal("could not create CPU profile: ", err)
	}

	// 获取系统信息
	if err := pprof.StartCPUProfile(f); err != nil { //监控cpu
		log.Fatal("could not start CPU profile: ", err)
	}
	defer pprof.StopCPUProfile()

	// 主逻辑区,进行一些简单的代码运算
	x := [row][col]int{}
	fillMatrix(&x)
	calculate(&x)

	f1, err := os.Create("mem.prof")
	if err != nil {
		log.Fatal("could not create memory profile: ", err)
	}
	//runtime.GC()                                       // GC,获取最新的数据信息
	if err := pprof.WriteHeapProfile(f1); err != nil { // 写入内存信息
		log.Fatal("could not write memory profile: ", err)
	}
	f1.Close()

	f2, err := os.Create("goroutine.prof")
	if err != nil {
		log.Fatal("could not create groutine profile: ", err)
	}

	if gProf := pprof.Lookup("goroutine"); gProf == nil {
		log.Fatal("could not write groutine profile: ")
	} else {
		gProf.WriteTo(f2, 0)
	}
	f2.Close()

}
调试
// 第一步、编译项目
$ go build prof.go
ls
// 第二步、启动程序
$ ./prof
// 再次编译程序
$ go build prof.go
// 查看目录文件
$ ls
cpu.prof mem.prof prof.go goroutine.prof prof
// 执行 go tool pprof 命令
$ go tool pprof prof cpu.prof
// 可以看到下面这样的一个交互式的控制台
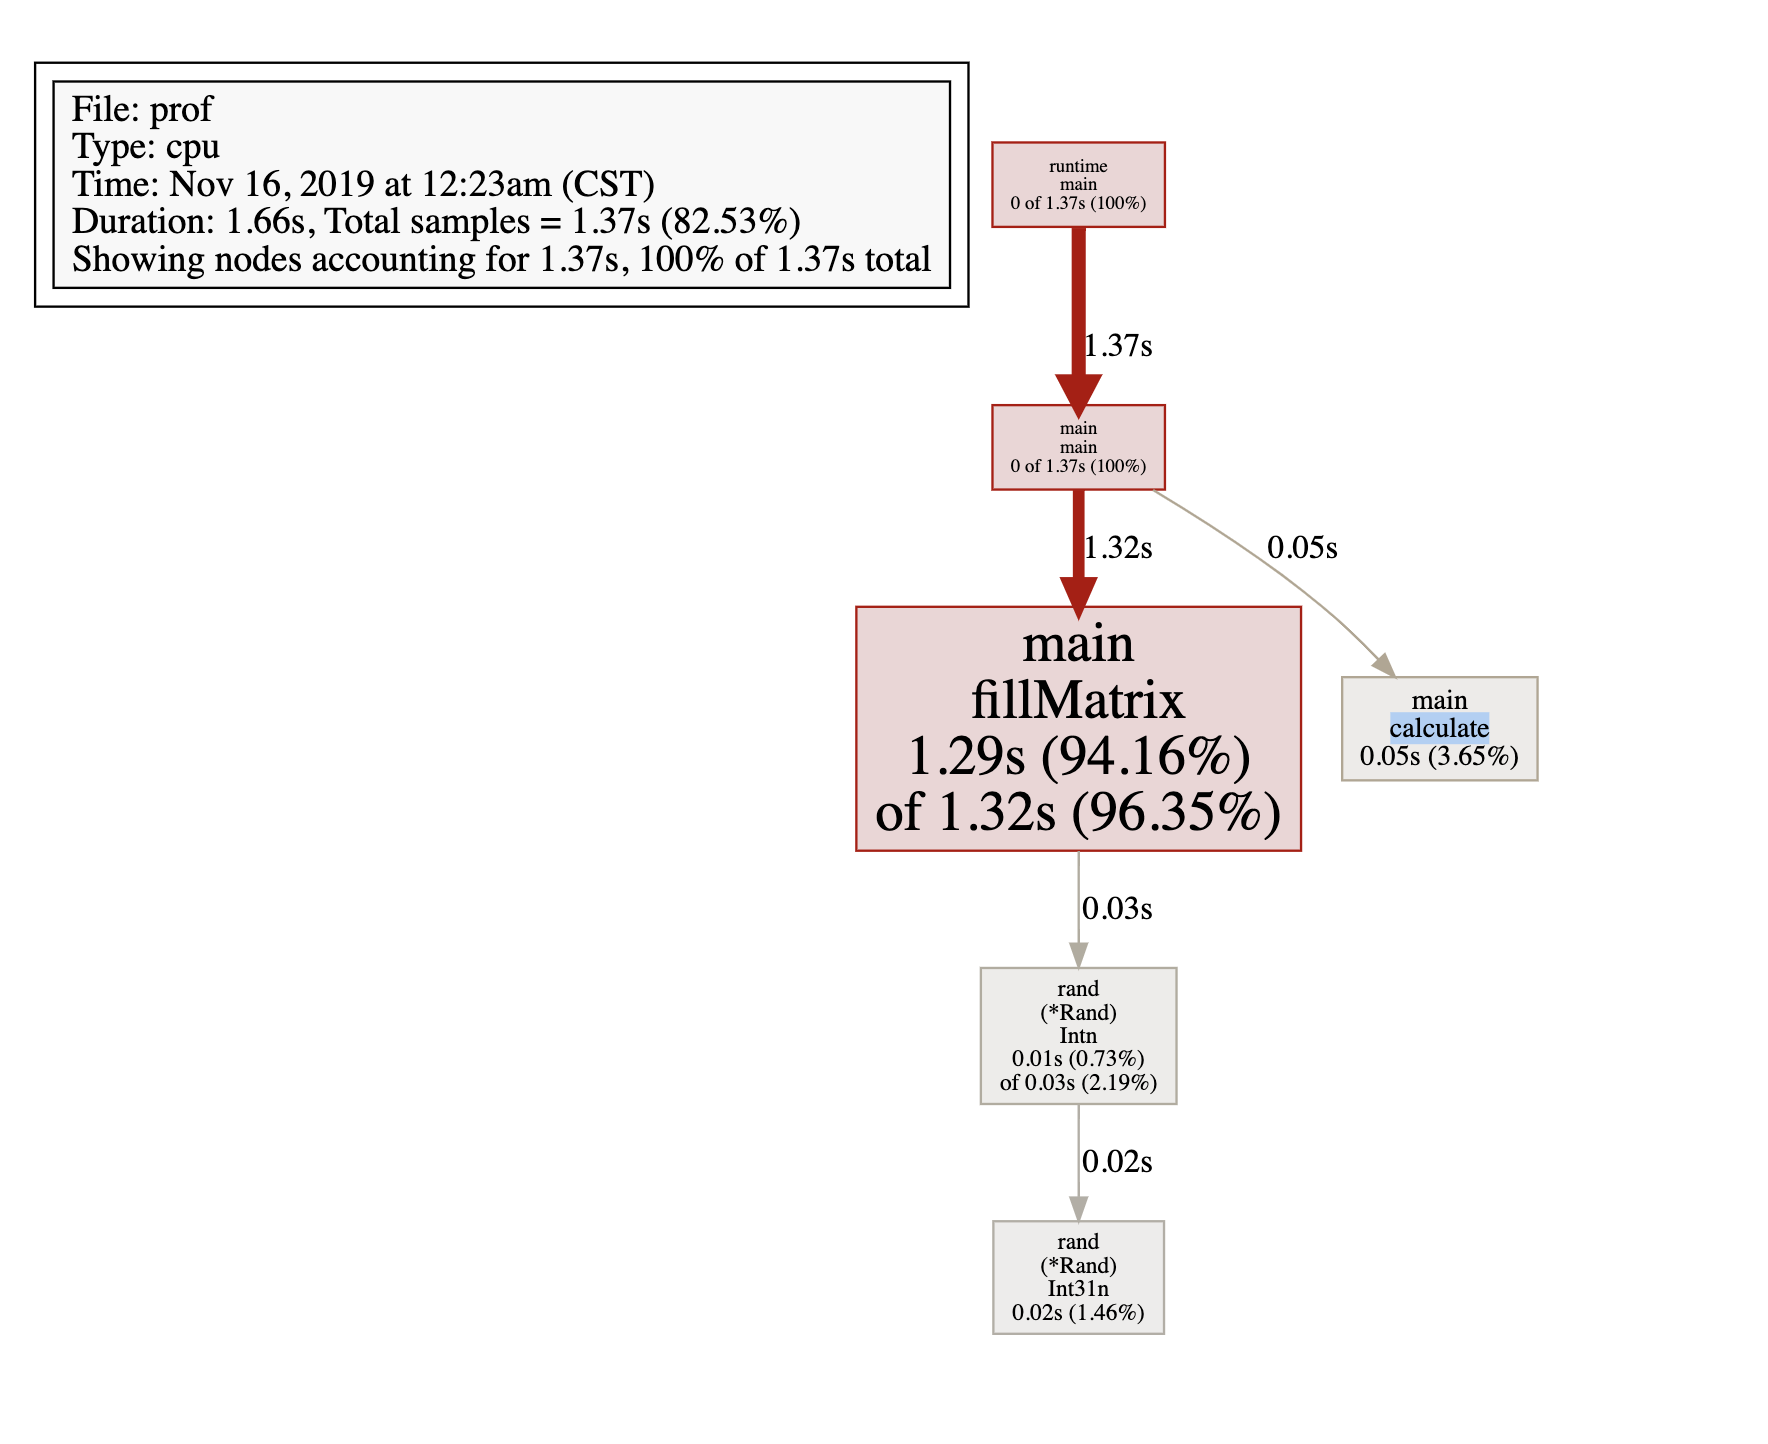
File: prof
Type: cpu
Time: Nov 16, 2019 at 12:23am (CST)
Duration: 1.66s, Total samples = 1.37s (82.53%)
Entering interactive mode (type "help" for commands, "o" for options)
(pprof)
// 可以使用 top 命令,看到top cpu 的情况
// cum 表示总体加和的时间
(pprof) top
Showing nodes accounting for 1.37s, 100% of 1.37s total
flat flat% sum% cum cum%
1.29s 94.16% 94.16% 1.32s 96.35% main.fillMatrix
0.05s 3.65% 97.81% 0.05s 3.65% main.calculate
0.02s 1.46% 99.27% 0.02s 1.46% math/rand.(*Rand).Int31n
0.01s 0.73% 100% 0.03s 2.19% math/rand.(*Rand).Intn
0 0% 100% 1.37s 100% main.main
0 0% 100% 1.37s 100% runtime.main
(pprof)
// 上述输出 可以体现出来 fillMatrix 耗时还是挺长的,我们可以使用list命令进行详细分析
// list 命令可以根据输入新的的名字进行最大匹配,不一定输入全部
(pprof) list fill
Total: 1.37s
ROUTINE ======================== main.fillMatrix in /Users/zhangwenjian/Code/golearning/src/ch44/tools/file/prof.go
1.29s 1.32s (flat, cum) 96.35% of Total
. . 16:func fillMatrix(m *[row][col]int) {
. . 17: s := rand.New(rand.NewSource(time.Now().UnixNano()))
. . 18:
. . 19: for i := 0; i < row; i++ {
. . 20: for j := 0; j < col; j++ {
1.29s 1.32s 21: m[i][j] = s.Intn(100000)
. . 22: }
. . 23: }
. . 24:}
. . 25:
. . 26:func calculate(m *[row][col]int) {
(pprof)
// 输出结果可以看出 所有的耗时都在 m[i][j] = s.Intn(100000)
// 也可以通过图形化的方式进行查看
// 可以通过 svg 命令 来生成 svg 图
(pprof) svg
Generating report in profile001.svg
(pprof)
// 使用浏览器打开之后也可以查看;
示例代码请访问:github.com/wenjianzhan…
