感觉有用就点个赞吧,给我一波小动力~~~
1、grid 图表位置
- 折线图、柱状图
grid: {
        top: '15%',
        right: '10%',
        left: '10%',
        bottom: '12%'
    },
- 饼图、仪表盘(写series里)、雷达图(写radar里)
center: ['50%', '50%'],   //圆的位置
radius: ['42%', '50%'],     //圆的环的大小
- 地图
//方法1......写在option里
layoutCenter: ["50%", "43%"], //位置
layoutSize: "68%", //百分比大小

//方法2......写在geo里
center: [123.83531246, 14.0267395887],
2、legend 图例
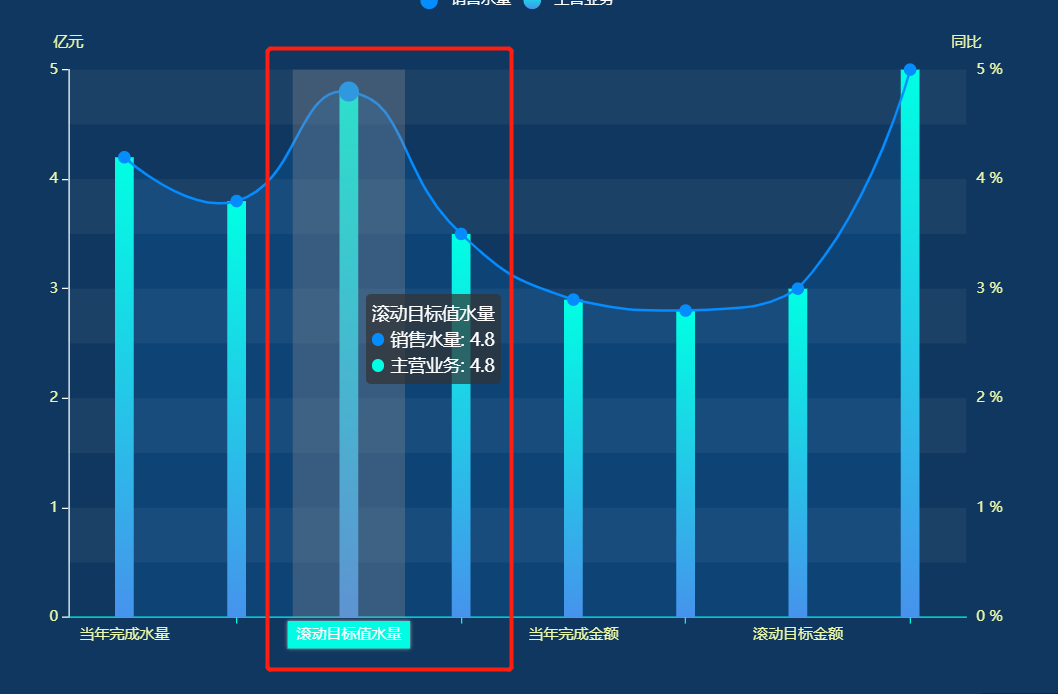
legend: {
        data: ["销售水量", "主营业务"],  //图例的数据
        top: "15%",   //图例的位置
        icon:"circle",  //图例的形状
        x: 'right',        //图例在右侧
        orient: 'vertical',  //图例纵向排布   horizontal为横向排布
        textStyle: {         //图例字体的颜色
            color: "#ffffff"
        }
    },
3、tooltip 图表提示框
tooltip: {
        show: true ,
        trigger: "axis",
        axisPointer: {
            type: "shadow",   //提示框类型
            label: {       //坐标轴指示器的文本标签
                show: true
            }
        }
    },

4、title 图表标题
title: {
            text: 'Snow蛋糕店-本周各类蛋糕销量',   //主标题
            subtext: '点击极坐标系下即可与圆环图交互\n点击柱状图排序',   //副标题
            textAlign: 'left',    //居左
            textStyle: {         //样式
                 fontSize: 20
             }
        },
5、xAxis X轴/yAxis Y轴
xAxis/yAxis: {
        data: category,
        name:"坐标轴名称",    //坐标轴名称
        min:10,         //X轴最小刻度
        max:50,         //X轴最大刻度
        nameGap: 15 ,   / /坐标轴名称与轴线之间的距离
        splitLine:{      //去除网格线
			show:true,
			lineStyle: {
			    color:"#fff"
			}
		},
        splitArea : {show : false},      //去除网格区域
        axisLine: {       //坐标轴轴线
            lineStyle: {           //坐标轴轴线颜色
                color: '#ccc'
            }
        },
        axisLabel:{           //坐标轴标签
                color:"#fff",
                interval:0,
                rotate:50    //X轴字体倾斜
        },
        axisTick: {   //坐标轴刻度
            show:false,   //不显示坐标轴刻度
        },
        rich:{   //自定义富文本样式

        }
    },
6、series 系列列表
series: [{
          name: '1',      //名称
          nameTextStyle: {
              color: "rgb(186,191,195)"    //x轴上方单位的颜色
            },
          type: 'bar',     //类型  柱状图
          stack: "总量",    //数据堆叠,判断是否叠加
          barWidth: '15%',    //柱子的宽度
          itemStyle: {         //图形样式
            normal: {
                color: new echarts.graphic.LinearGradient(0, 0, 0, 1, [{    //颜色渐变
                    offset: 0,
                    color: '#fccb05'
                }, {
                    offset: 1,
                    color: '#f5804d'
                }]),
                barBorderRadius: 12,
            },
          },
          data: [400, 400, 300, 300, 300, 400, 400, 400, 300]    //数据
        },
        {
            name: "总数",
            type: "line",    //样式  折线
            smooth: true,   //折线是否平滑
            symbolSize:10,   //标记的大小
            symbol:'circle',   //标记的类型
            lineStyle: {
                normal: {
                width: 8,           //折线线条粗细设置
                color: {             //折线颜色渐变
                    type: 'linear',
                    colorStops: [{
                        offset: 0,
                        color: '#A9F387' // 0% 处的颜色
                    }, {
                        offset: 1,
                        color: '#48D8BF' // 100% 处的颜色
                    }],
                    globalCoord: false // 缺省为 false
                },
                shadowColor: 'rgba(72,216,191, 0.3)',
                shadowBlur: 10,
                shadowOffsetY: 20
          },
            itemStyle: {       //折线拐点标记
                normal: {
                    color: "rgba(252,230,48,1)",
                    barBorderRadius: 0,
                    label: {
                        "show": true,
                        "position": "top",
                    }
                }
            },
            areaStyle: {   //填充区域样式
              normal: {
                color: new echarts.graphic.LinearGradient(0, 0, 0, 1, [
                  { offset: 0, color: "red" },
                  { offset: 0.5, color: "pink" },
                  { offset: 1, color: "black" }
                ])
              }
            },
        },
        {
          name: '3',
          type: 'bar',
          stack: "总量",
          barWidth: '15%',
          itemStyle: {
            normal: {
                color: new echarts.graphic.LinearGradient(0, 0, 0, 1, [{
                    offset: 0,
                    color: '#248ff7'
                }, {
                    offset: 1,
                    color: '#6851f1'
                }]),
            barBorderRadius: 11,
            }
          },
          data: [400, 600, 700, 700, 1000, 400, 400, 600, 700]
        }]
7、tip(如果折线图的区域的颜色渐变不生效,可用此方法)
areaStyle: {
              normal: {
                color: {
                  type: "linear",
                  x: 0,
                  y: 0,
                  x2: 0,
                  y2: 1,
                  colorStops: [
                    {
                      offset: 0,
                      color: "rgba(26,75,106,1)" // 0% 处的颜色
                    },
                    {
                      offset: 1,
                      color: "rgba(26,75,106,0)" // 100% 处的颜色
                    }
                  ],
                  global: false // 缺省为 false
                }
              }

感觉有用就点个赞吧~~~