<!DOCTYPE html>
<html lang="en">
<head>
<meta charset="utf-8">
<title>立体柱状图</title>
<style>
.side {
fill: #4D5A85;
}
.facade {
fill: #7185C5;
}
.top-path {
fill: #6678B1;
transform: skew(295deg, 0);
}
.number {
text-anchor: middle;
font-family: sans-serif;
font-size: 11px;
fill: white;
}
</style>
</head>
<body>
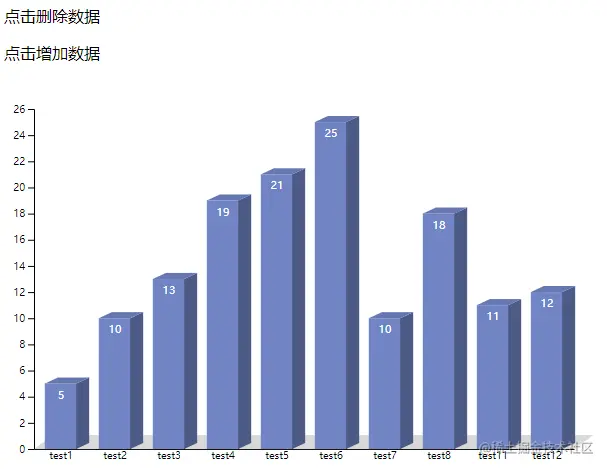
<p id="delete">点击删除数据</p>
<p id="add">点击增加数据</p>
<script src="https://d3js.org/d3.v6.min.js"></script>
<script type="text/javascript">
const columnar = {
key: 'append',
target: null,
facade({width, height}) {
let data = this.target[this.key]("rect");
if (this.key === 'append') {
data.classed('facade', true);
}
data.attr("width", width)
.attr("height", height);
},
side({x, width, height}) {
let data = null
if (this.key === 'append') {
data = this.target[this.key]("rect").classed('side', true);
} else {
data = this.target[this.key]("rect.side")
}
data.style('transform', `translate(${x - 1}px, 0) skew(0, -25deg)`)
.attr("width", width)
.attr("height", height);
},
path({lx, ly}) {
let data = this.target[this.key]("path")
if (this.key === 'append') {
data.classed('top-path', true)
}
data.attr('d', `M0 0 L0 -${ly} L${lx - 1} -${ly} L${lx - 1} 0 Z`);
},
};
function exit(target, obj) {
let key = Object.keys(obj)[0];
target.exit()
.transition()
.duration(500)
.attr(key, obj[key])
.remove();
}
function key(d) {
return d.key
}
function barHeight(d) {
return h - yScale(d.value) - padding
}
let w = 600;
let h = 400;
let padding = 30;
let dataset = [
{key: 0, value: 5, name: 'test1'},
{key: 1, value: 10, name: 'test2'},
{key: 2, value: 13, name: 'test3'},
{key: 3, value: 19, name: 'test4'},
{key: 4, value: 21, name: 'test5'},
{key: 5, value: 25, name: 'test6'},
{key: 6, value: 10, name: 'test7'},
{key: 7, value: 18, name: 'test8'},
{key: 10, value: 11, name: 'test11'},
{key: 11, value: 12, name: 'test12'},
];
let xScale = d3.scaleBand()
.domain(d3.range(dataset.length))
.range([padding, w - padding])
.paddingInner(5 >= dataset.length ? 0.6 : 0.4)
.paddingOuter(0.2);
let yScale = d3.scaleLinear()
.domain([0, d3.max(dataset, (d) => {
return d.value
})])
.range([h - padding, padding])
.nice();
let svg = d3.select("body")
.append("svg")
.attr("width", w)
.attr("height", h);
let yAxis = d3.axisLeft(yScale);
let xAxis = d3.axisBottom(xScale).tickFormat((d) => {
return dataset[d].name
}).tickSizeOuter(0).tickSizeInner(0);
svg.append('g')
.classed('x-axis',true)
.attr('transform', `translate(0,${h - padding})`)
.call(xAxis)
.append('rect')
.attr('width',d3.select('g').node().getBBox().width)
.attr('height',d3.select('g').node().getBBox().height)
.attr('y',-d3.select('g').node().getBBox().height +1)
.attr('x',padding)
.attr('fill','#d9d9d9')
.style('transform','skew(306deg, 0deg)');
svg.append('g')
.classed('y-axis',true)
.attr('transform', `translate(${padding},0)`)
.call(yAxis);
svg.append('clipPath')
.attr("id", "chart-area")
.append("rect")
.attr("x", padding)
.attr('width', w - padding * 1.8)
.attr('height', h);
let g = svg.append("g")
.attr("clip-path", "url(#chart-area)")
.classed('clip-path', true);
let barGroups = g.selectAll("g")
.data(dataset, key)
.enter()
.append("g")
.classed('bar', true)
.attr("transform", function (d, i) {
return `translate(${xScale(i)},${yScale(d.value)})`;
});
columnar.target = barGroups
columnar.facade({width: xScale.bandwidth(), height: barHeight});
let sideWidth = xScale.bandwidth() / 2.5;
columnar.side({x: xScale.bandwidth(), width: sideWidth, height: barHeight});
columnar.path({lx: xScale.bandwidth(), ly: sideWidth * 0.47});
g.selectAll("text")
.data(dataset, key)
.enter()
.append("text")
.classed('number', true)
.text(function (d) {
return d.value;
})
.attr("x", function (d, i) {
return xScale(i) + xScale.bandwidth() / 2;
})
.attr("y", function (d) {
return yScale(d.value) + 15;
});
d3.selectAll("p").on("click", function () {
let pId = d3.select(this).attr('id');
if (pId === 'delete') {
dataset.shift();
} else {
let lastKeyValue = dataset[dataset.length - 1].key;
dataset.push({
key: lastKeyValue + 1,
value: Math.floor(Math.random() * 60) + 2,
name: `test${lastKeyValue + 1}`
});
}
xScale.domain(d3.range(dataset.length));
yScale.domain([0, d3.max(dataset, (d) => {
return d.value
})]).range([h - padding, padding])
.nice();
let clipPath = svg.select(".clip-path");
let bars = clipPath.selectAll("g").data(dataset, key);
let barsEnter = bars.enter()
.append("g")
.classed('bar', true)
.attr("transform", function (d, i) {
return `translate(${xScale(i) + padding + 50},${yScale(d.value)})`;
})
.merge(bars)
.transition()
.duration(500)
.attr("transform", function (d, i) {
return `translate(${xScale(i)},${yScale(d.value)})`;
});
sideWidth = xScale.bandwidth() / 2.5;
if (pId === 'add') {
let lastBars = clipPath.selectAll('g');
let len = lastBars.size() - 1;
let lastG = lastBars.filter((d, i) => {
if (len === i) {
return this
}
});
columnar.key = 'append'
columnar.target = lastG
columnar.facade({target: lastG, width: xScale.bandwidth(), height: barHeight});
columnar.side({target: lastG, x: xScale.bandwidth(), width: sideWidth, height: barHeight});
columnar.path({target: lastG, lx: xScale.bandwidth(), ly: sideWidth * 0.47});
}
columnar.key = 'selectAll'
columnar.target = barsEnter
columnar.facade({target: barsEnter, width: xScale.bandwidth(), height: barHeight, key: 'selectAll'})
columnar.side({target: barsEnter, x: xScale.bandwidth(), width: sideWidth, height: barHeight, key: 'selectAll'})
columnar.path({target: barsEnter, lx: xScale.bandwidth(), ly: sideWidth * 0.47, key: 'selectAll'})
exit(bars, {
transform(d) {
return `translate(${-xScale.bandwidth()},${yScale(d.value)})`;
}
});
let text = clipPath.selectAll("text")
.data(dataset, key);
exit(text, {'x': -xScale.bandwidth()});
text.enter()
.append("text")
.classed('number', true)
.text(function (d) {
return d.value;
})
.attr("text-anchor", "middle")
.attr("x", (d, i) => {
return `${xScale(i) + padding * 2}`
})
.attr("y", function (d) {
return yScale(d.value) + 15;
})
.merge(text)
.transition()
.duration(500)
.attr("x", function (d, i) {
return xScale(i) + xScale.bandwidth() / 2;
})
.attr("y", function (d) {
return yScale(d.value) + 15;
});
svg.selectAll(".x-axis")
.transition()
.duration(500)
.call(xAxis);
svg.selectAll(".y-axis")
.transition()
.duration(500)
.call(yAxis)
});
</script>
</body>
</html>


