代码示例:
$(document).ready(function () {
var myChart = echarts.init(document.getElementById("container-one-content"));
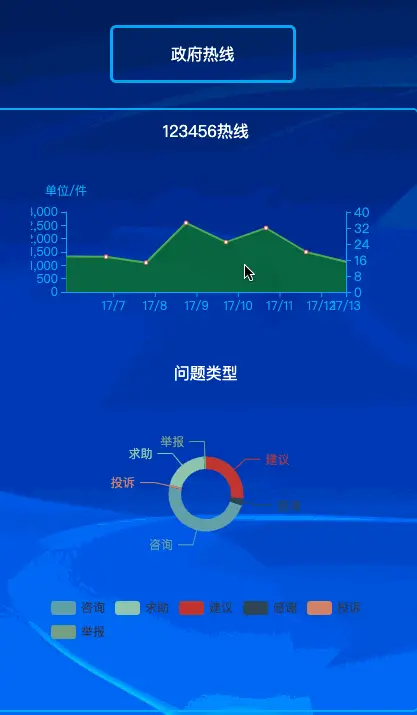
// 123456热线
var option = {
xAxis: {
type: "category",
boundaryGap: false,
data: ["17/1", "17/2", "17/3", "17/4", "17/5", "17/6", "17/7", "17/8", "17/9", "17/10", "17/11", "17/12", "17/13", "17/14"],
axisLine: {
lineStyle: {
color: "#03A9F4"
}
}
},
yAxis: [
{
name: "单位/件",
type: "value",
axisLine: {
lineStyle: {
color: "#03A9F4"
}
},
splitLine: {
//网格线
show: false
}
},
{
type: "value",
min: 0,
max: 1000,
axisLine: {
lineStyle: {
color: "#03A9F4"
}
},
splitLine: {
//网格线
show: false
},
axisLabel: {
show: true,
formatter: function (value, index) {
return value / 25;
},
show: true,
color: "#03A9F4",
fontSize: 13
}
}
],
series: [
{
data: [820, 932, 901, 2234, 1290, 1330, 1320, 1100, 2590, 1870, 2400, 1500, 1133, 888],
type: "line",
areaStyle: {
color: "green"
},
lineStyle: {
color: "#4CAF50"
}
}
],
dataZoom: [
{
id: 'dataZoomX',
type: 'inside',
xAxisIndex: [0],
filterMode: 'none',
start: 0,
end: 50
}
]
};
// 使用刚指定的配置项和数据显示图表。
myChart.setOption(option);
效果图