

百度有很多这样教程的博客,我今天就自己看着他们的教程一步步来,以下是自己的步骤:
安装phpXdebug扩展
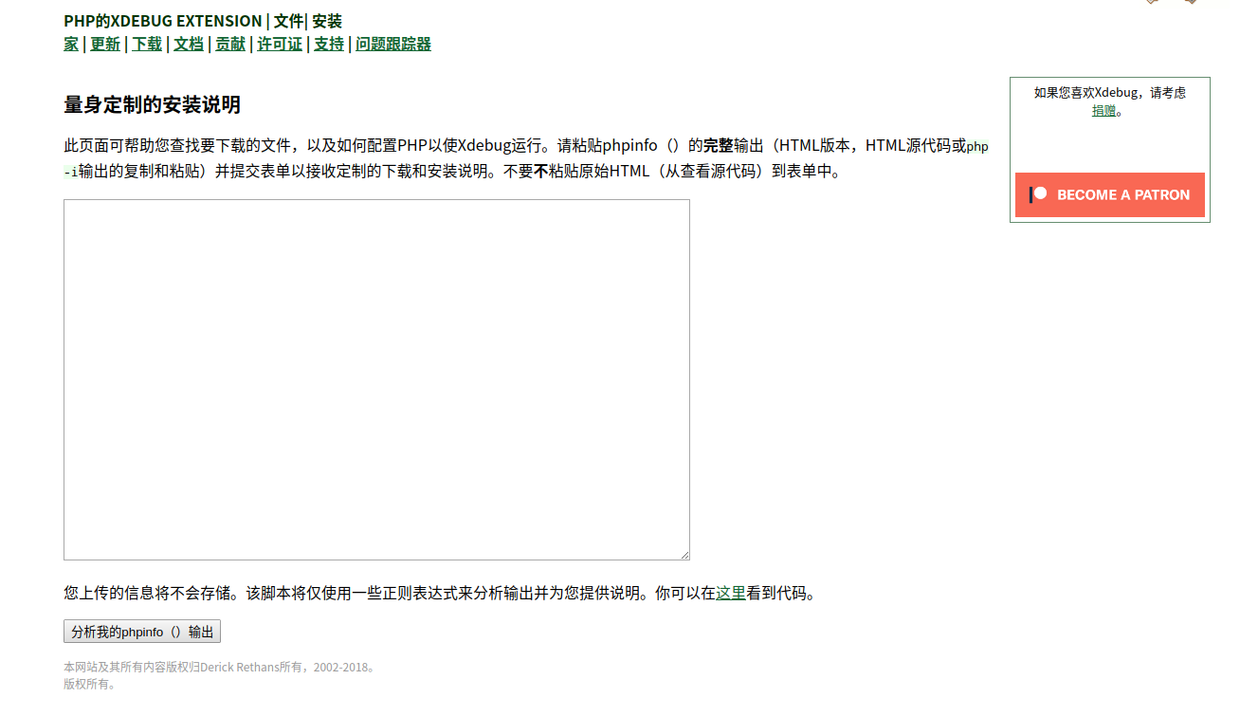
注意要点: 1、Xdebug版本选择 在这里可以输出自己当前环境的phpinfo()信息,在这个网站上: xdebug.org/wizard.php
[Xdebug]
zend_extension =C:\phpStudy\PHPTutorial\php\php-7.0.12-nts\ext\php_xdebug-2.6.1-7.0-vc14-nts.dll
xdebug.collect_params = 1

xdebug.collect_return = 1

xdebug.auto_trace = 0

xdebug.profiler_enable = 0

xdebug.max_nesting_level = 1000000

xdebug.remote_enable = 1

xdebug.remote_host = localhost

xdebug.remote_port = 9000

xdebug.remote_handler = dbgp

xdebug.idekey = netbeans-xdebug

xdebug.remote_autostart=1
浏览器安装Xdebug扩展程序
可以选择在google和火狐设置上下载相应的扩展程序(google可能要翻墙?)
配置phpstorm Xdebug
百度有详细的图片教程,不明白的可以自己百度,这里这是说下步骤。 注意事项: 1、端口与php.ini一致 2、当报错“ Please configure PHP Interpreter to use built-in web server”时,记得添加php服务
打开phpstorm监听、运行
一般打开后会弹出一个默认浏览器,url地址会出现类似“?_ijt=rrcoujae241qpqhg1p6oh9kbjh”,然后你改下前面的访问地址就可以了。 例如: http://localhost:63342/xxx/xxx/xxxxxx/controllers/OrderController.php?_ijt=rrcoujae241qpqhg1p6oh9kbjh 变为: http://localhost/order/orderlist?_ijt=rrcoujae241qpqhg1p6oh9kbjh 可能有设置可以改为直接点击调试的,但我还没不清楚怎么能,如果你们知道怎么设置,请一定要告诉我哦。
==== 可以直接进行调试,只需要改下端口和路径就可以啦!
原文作者:------ 沙蒿 ------ 关注我吧《程序员的碎碎念》作者,不会ui的前端不是好后端 不忘初心,牢记使命,对于文章内容有疑问的或者深入交流学习的朋友可以加我微信:2283743369
