

-
选用方式 Prometheus+Grafans的方式进行监控,Prometheus作为一个数据源进行数据采集,而Grafans作为一个图形化界面增加性能指标、通知等。
-
为什么记录 在现有的微服务架构下实现服务性能指标监控,服务注册中心使用eureka,springCloud版本为Edgware.SR3,springBoot版本是1.5.12.RELEASE。由于版本停留在1.5.X,spring官方在2.0 开始对actuator做了更多的集成工作,Prometheus 官方文档上只提供了对consul的支持、
-
开始集成
- eureka增加依赖
	<dependency>
		<groupId>at.twinformatics</groupId>
		<artifactId>eureka-consul-adapter</artifactId>
		<version>0.0.1</version>
	</dependency>
eureka-consul-adapter的版本需要注意:
| 版本 | Spring Boot | Spring Cloud | | --- | :-: | :-: | | 1.1.x | 2.1.x | Greenwich | | 1.0.x | 2.0.x | Finchley | | 0.x | 1.5.x | Edgware |-
Client的修改
- 增加依赖
<!--使用 Micrometer 的通用 API 来收集性能指标-->
<dependency>
    <groupId>io.micrometer</groupId>
    <artifactId>micrometer-registry-prometheus</artifactId>
    <version>1.1.1</version>
</dependency>
``` management: metrics: distribution: percentiles-histogram: true # 监控 security: false #开发环境开启,生产环境需要关闭 ``` 到这里代码代码上的集成结束,启动eureka和client。 -
启动Prometheus 下载对于的Prometheus版本,mac需要狭隘darwin版本。解压后修改prometheus.yml文件增加springCloud的监控节点。
scrape_configs:
  # The job name is added as a label `job=<job_name>` to any timeseries scraped from this config.
  - job_name: 'prometheus'

    # metrics_path defaults to '/metrics'
    # scheme defaults to 'http'.

    static_configs:
    - targets: ['localhost:9090']  //prometheus的web地址

  - job_name: 'SPRING_CLOUD' //名称
    scheme: http //请求协议
    metrics_path: '/prometheus'  //路径 actuator1.0的路径是/prometheus,2.0的路径为/actuator/prometheus。
    consul_sd_configs:
    #consul 地址
      - server: '127.0.0.1:8888'  //eureka的地址
        scheme: http
        services: [GIFTCARD]    //要监听的服务名称,必须和eureka web页面上展示的一致 ```
在解压的目录下,启动prometheus,启动完成后打开 localhost:9090,展开 status-Targets标签,可以看到新增的监控源。

   到这里Prometheus 也配置结束。
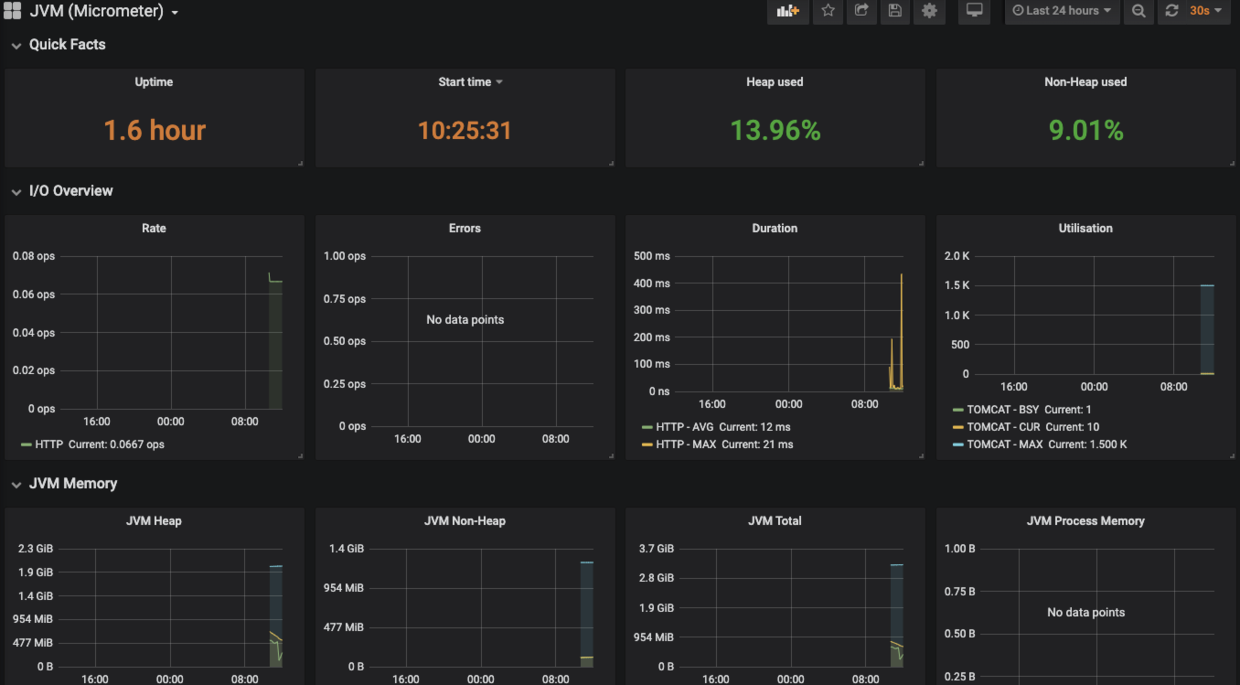
- 配置Grafana
下载解压后启动,mac下可以使用brew安装,brew server start grafana启动服务,默认的端口是3000,默认用户名与密码都是admin,进入后修改密码。
在dashboards下载需要展示的模板,选择+、选择import,导入json选择Prometheus数据源。
参考链接:
