

地图投影
这里使用的是 topoJSON 而非是 geoJSON 数据。网站也有许多网站能够转化文件。
<!doctype html>
<html lang="en">
<head>
    <meta charset="UTF-8">
    <meta name="viewport"
          content="width=device-width, user-scalable=no, initial-scale=1.0, maximum-scale=1.0, minimum-scale=1.0">
    <meta http-equiv="X-UA-Compatible" content="ie=edge">
    <title>Document</title>
    <style>
        path {
            fill: #ccc;
            stroke: #fff;
            stroke-width: .5px;
        }
        .state:hover {
            fill: red;
        }
    </style>
</head>
<body>
<script src="../d3.js"></script>
<script src="https://unpkg.com/topojson@3"></script>
<script>
    const width = 960,
          height = 500

    const path = d3.geoPath().projection(d3.geoAlbersUsa())

    const svg = d3.select('body').append('svg')
        .attr('width', width)
        .attr('height', height)

    const g  = svg.append('g').call(d3.zoom().scaleExtent([1, 10]).on('zoom', zoomHandle))

    function zoomHandle() {
        const transform = d3.event.transform
        svg.select('g').attr('transform', `translate(${transform.x}, ${transform.y}) scale(${transform.k})`)
    }

    d3.json('./us.json').then(data => {

      g.selectAll('path.state')
        .data(topojson.feature(data, data.objects.states).features)
        .enter()
        .append('path')
            .attr('class', 'state')
            .attr('d', d => path(d))

    })
</script>
</body>
</html>
效果如下:
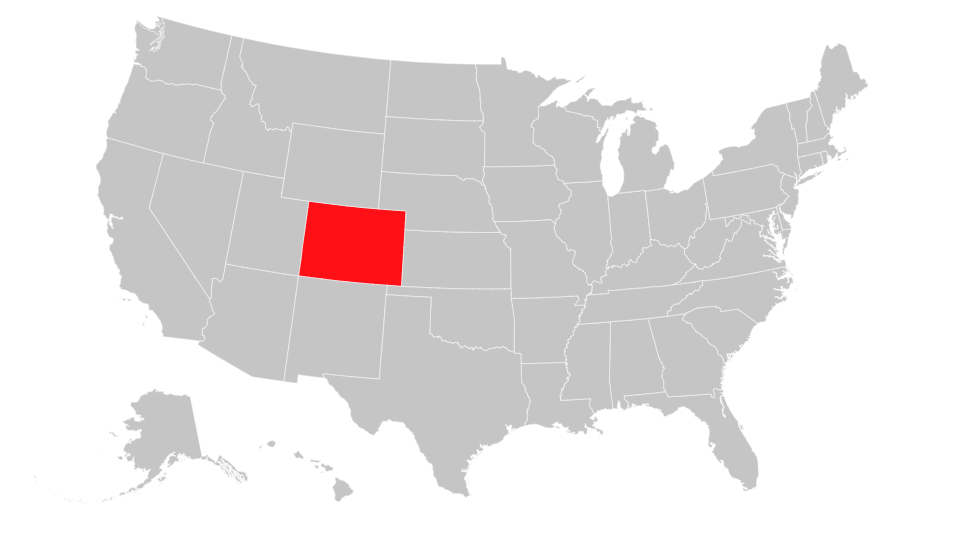
topoJSON 文档见:github.com/topojson/to…
我们先给 svg 定义了平移缩放,然后通过以下关键代码渲染了地图:
const path = d3.geoPath().projection(d3.geoAlbersUsa())

g.selectAll('path.state')
    .data(topojson.feature(data, data.objects.states).features)
    .enter()
    .append('path')
        .attr('class', 'state')
        .attr('d', d => path(d))
我们定义了一个地图的 path 生成器,通过 projection 方法设置生成器的投影方式。然后我们通过 topojson 拿到 地图数据中各个州的数据,通过 path 元素和生成器渲染到页面上。
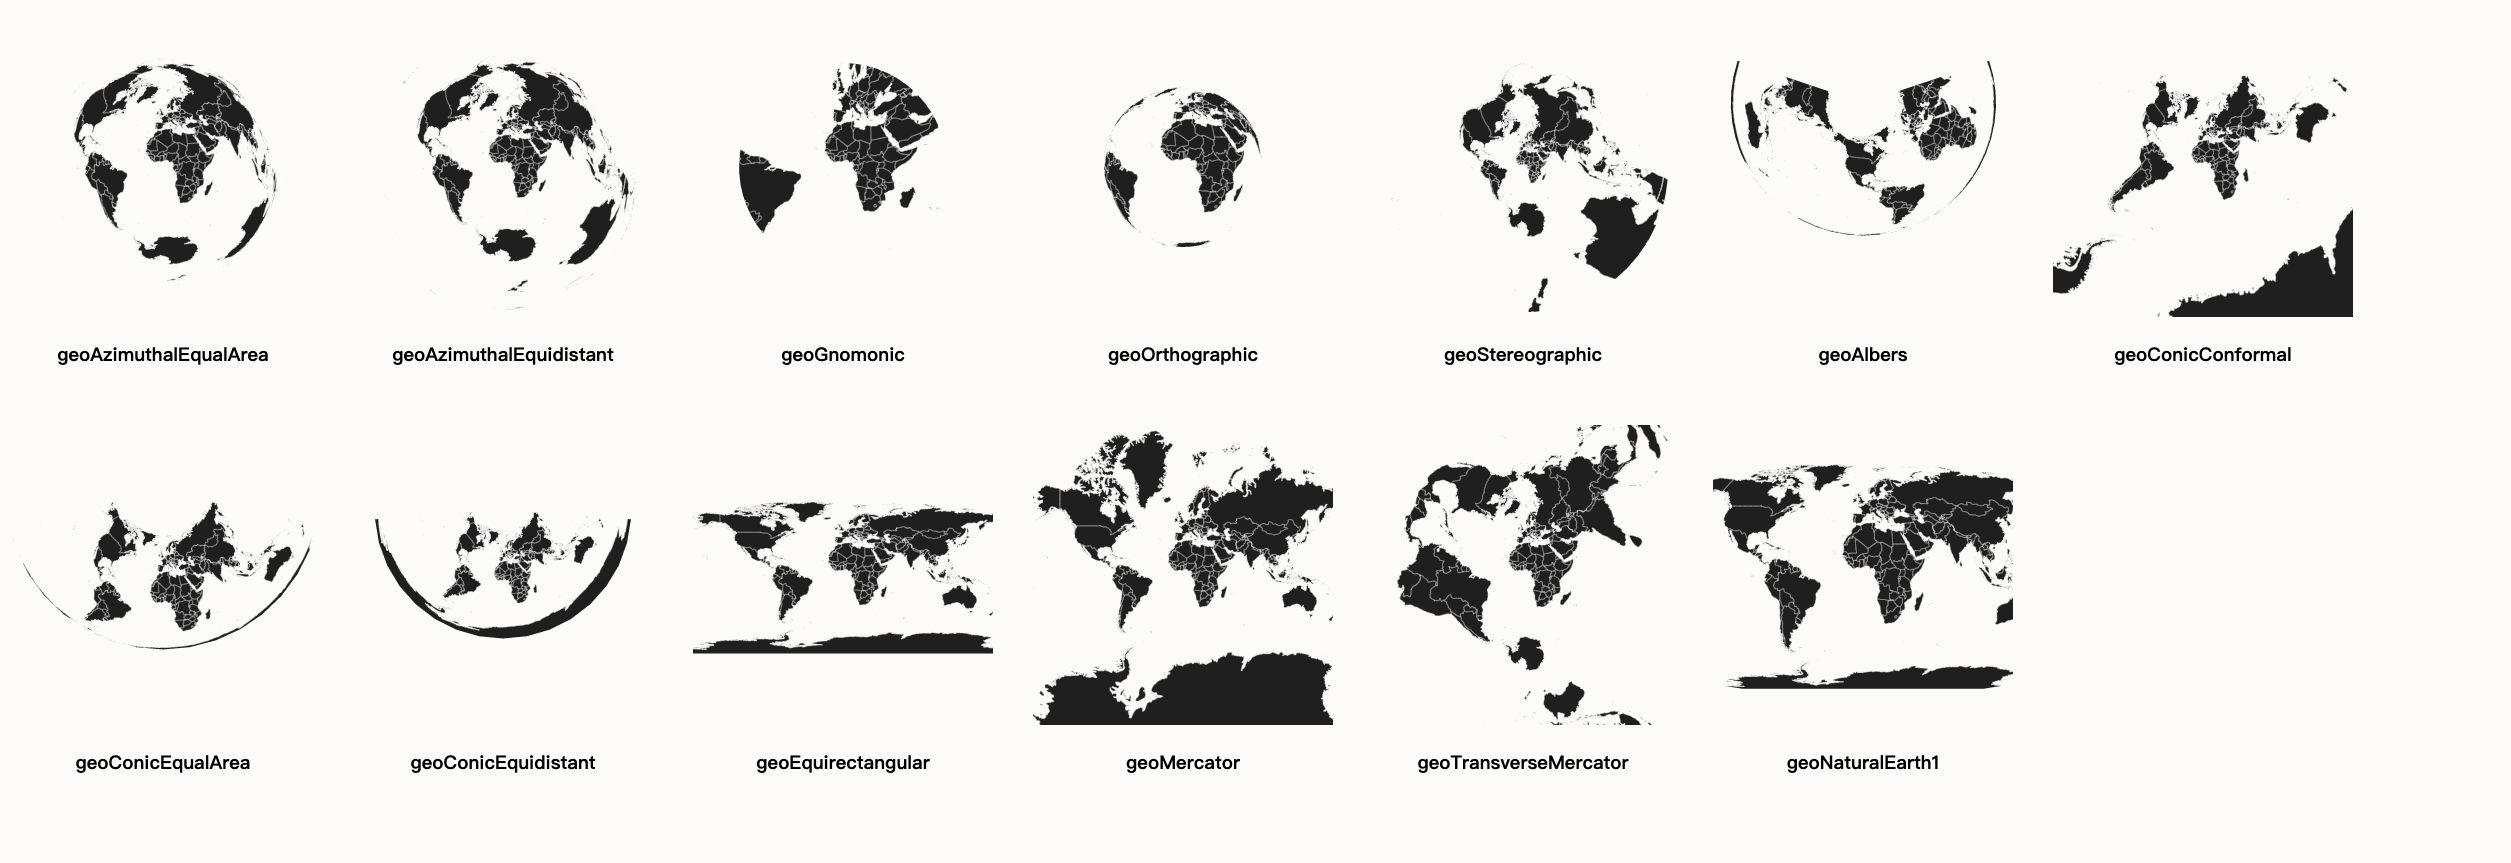
d3 中常见的投影方式见下例。
投影方式
<!doctype html>
<html lang="en">
<head>
    <meta charset="UTF-8">
    <meta name="viewport"
          content="width=device-width, user-scalable=no, initial-scale=1.0, maximum-scale=1.0, minimum-scale=1.0">
    <meta http-equiv="X-UA-Compatible" content="ie=edge">
    <title>Document</title>
    <style>
        body {
            background: #fcfcfa;
        }
        .map {
            float: left;
            margin: 20px;
            text-align: center;
        }
        .land {
            fill: #222;
        }
        .boundary {
            fill: none;
            stroke: #fff;
            stroke-width: .5px;
        }
    </style>
</head>

<body>
<script src="../d3.js"></script>
<script src="https://unpkg.com/topojson@3"></script>
<script>
    const width = 300,
          height = 300,
          translate = [width / 2, height / 2],
          projections = [
            {name: 'geoAzimuthalEqualArea', fn: d3.geoAzimuthalEqualArea().scale(60).translate(translate)},
            {name: 'geoAzimuthalEquidistant', fn: d3.geoAzimuthalEquidistant().scale(50).translate(translate)},
            {name: 'geoGnomonic', fn: d3.geoGnomonic().scale(60).translate(translate)},
            {name: 'geoOrthographic', fn: d3.geoOrthographic().scale(80).translate(translate)},
            {name: 'geoStereographic', fn: d3.geoStereographic().scale(50).translate(translate)},
            {name: 'geoAlbers', fn: d3.geoAlbers().scale(50).translate(translate)},
            {name: 'geoConicConformal', fn: d3.geoConicConformal().scale(40).translate(translate)},
            {name: 'geoConicEqualArea', fn: d3.geoConicEqualArea().scale(50).translate(translate)},
            {name: 'geoConicEquidistant', fn: d3.geoConicEquidistant().scale(35).translate(translate)},
            {name: 'geoEquirectangular', fn: d3.geoEquirectangular().scale(50).translate(translate)},
            {name: 'geoMercator', fn: d3.geoMercator().scale(50).translate(translate)},
            {name: 'geoTransverseMercator', fn: d3.geoTransverseMercator().scale(50).translate(translate)},
            {name: 'geoNaturalEarth1', fn: d3.geoNaturalEarth1().scale(80).translate(translate)}
          ]

    d3.json('./world-50m.json').then(data => {
        projections.forEach(projection => {
            const path = d3.geoPath().projection(projection.fn)

            const div = d3.select('body')
                .append('div')
                    .attr('class', 'map')

            const svg = div.append('svg')
                .attr('width', width)
                .attr('height', height)

            svg.append('path')
                .datum(topojson.feature(data, data.objects.land))
                    .attr('class', 'land')
                    .attr('d', d => path(d))

            svg.append('path')
                .datum(topojson.mesh(data, data.objects.countries))
                    .attr('class', 'boundary')
                    .attr('d', path)

            div.append('h3').text(projection.name)
        })
    })
</script>
</body>
</html>
各投影方式的效果如下:
等值区域图(热度地图)
<!doctype html>
<html lang="en">
<head>
    <meta charset="UTF-8">
    <meta name="viewport"
          content="width=device-width, user-scalable=no, initial-scale=1.0, maximum-scale=1.0, minimum-scale=1.0">
    <meta http-equiv="X-UA-Compatible" content="ie=edge">
    <title>Document</title>
    <style>
        .states {
            fill: none;
            stroke: #fff;
            stroke-width: .5px;
        }
    </style>
</head>
<body>
<script src="../d3.js"></script>
<script src="https://unpkg.com/topojson@3"></script>
<script>
    const width = 960,
          height = 600,
          colors = d3.scaleLinear()
            .domain([0.02, 0.04, 0.06, 0.08, 0.10])
            .range(d3.schemeRdBu[6].reverse()),
          path = d3.geoPath().projection(d3.geoAlbersUsa()),
          svg = d3.select('body').append('svg')
            .attr('width', width)
            .attr('height', height),
          g = svg.append('g').call(
            d3.zoom()
                .scaleExtent([1, 10])
                .on('zoom', zoomHandle)
          )

    function zoomHandle() {
        const transform = d3.event.transform
        g.attr('transform', `translate(${transform.x}, ${transform.y}) scale(${transform.k})`)
    }

    svg.append('text').text('2008年美国失业热度图').attr('transform', 'translate(400, 550)')

    d3.json('./us.json').then(us => {
        d3.tsv('./unemployment.tsv').then(unemployment => {
          const map = new Map()

          unemployment.forEach(d => {
                map.set(Number(d.id), Number(d.rate))
          })

          g.append('g').selectAll('path')
                .data(topojson.feature(us, us.objects.counties).features)
                .enter()
                .append('path')
                    .attr('d', d => path(d))
                    .attr('fill', d => colors(map.get(d.id)))

          g.append('path')
                .datum(topojson.mesh(us, us.objects.states))
                .attr('class', 'states')
                .attr('d', d => path(d))
        })
    })
</script>
</body>
</html>
效果如下:
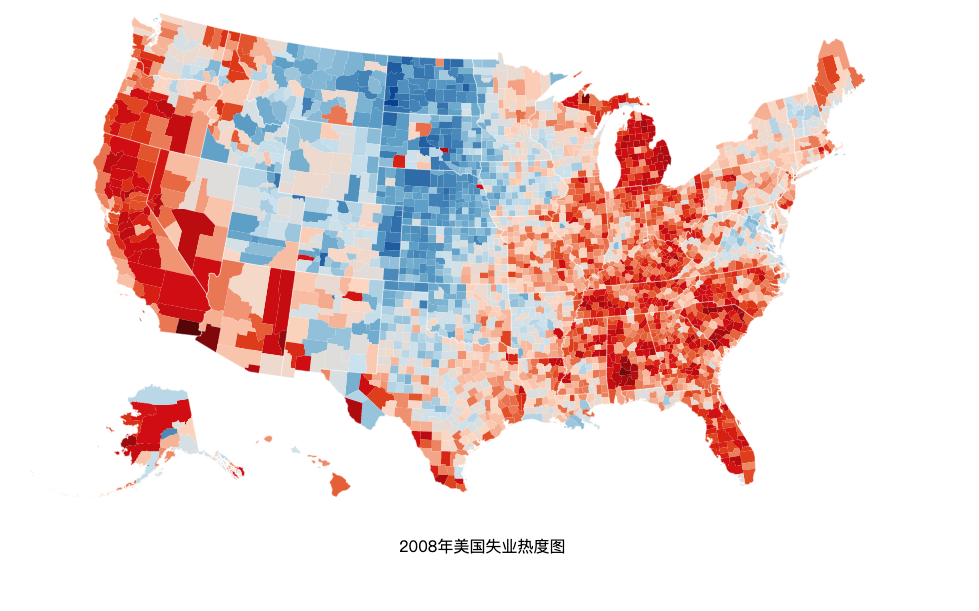
在请求到地图数据和每个区域的失业值后,我们先是把失业数据置入一个 map 中,
const map = new Map()
unemployment.forEach(d => {
    map.set(Number(d.id), Number(d.rate))
})
这便于我们通过每个区域的 id 值找到其对应的失业率。
我们先通过
g.append('g').selectAll('path')
    .data(topojson.feature(us, us.objects.counties).features)
    .enter()
    .append('path')
        .attr('d', d => path(d))
        .attr('fill', d => colors(map.get(d.id)))
绘制出各个区,并以失业率值对应的颜色填充,然后再通过下面的代码绘制出各个州的轮廓:
 g.append('path')
    .datum(topojson.mesh(us, us.objects.states))
    .attr('class', 'states')
    .attr('d', d => path(d))
