线图 面积图
<!doctype html>
<html lang="en">
<head>
    <meta charset="UTF-8">
    <meta name="viewport"
          content="width=device-width, user-scalable=no, initial-scale=1.0, maximum-scale=1.0, minimum-scale=1.0">
    <meta http-equiv="X-UA-Compatible" content="ie=edge">
    <title>Document</title>
    <style>
        .line {
            fill: none;
            stroke: steelblue;
            stroke-width: 2;
        }
        .grid-line{
            stroke: black;
            shape-rendering: crispEdges;
            stroke-opacity: .2;
        }
        .area {
            stroke: none;
            fill: steelblue;
            fill-opacity: .2;
        }
        .dot {
            fill: #fff;
            stroke: steelblue;
        }
    </style>
</head>
<body>
<script src="../d3.js"></script>
<script>
    function areaChart() {
        const _chart = {}

        let _width = 600,
            _height = 300,
            _margins = {
                top: 30,
                right: 30,
                bottom: 30,
                left: 30
            },
            _colors = d3.scaleOrdinal(d3.schemeCategory10),
            _data = []

        let _x,
            _y,
            _svg,
            _body

        _chart.width = function (width) {
            if (!arguments.length) return _width
            _width = width
            return _chart
        }

        _chart.height = function (height) {
            if (!arguments.length) return _height
            _height = height
            return _chart
        }

        _chart.margins = function (margins) {
              if (!arguments.length) return _margins
              _margins = margins
              return _chart
        }

        _chart.colors = function (colorScale) {
            if (!arguments.length) return _colors
            _colors = colorScale
            return _chart
        }

        _chart.x = function (xScale) {
            if (!arguments.length) return _x
            _x = xScale
            return _chart
        }

        _chart.y = function (yScale) {
          if (!arguments.length) return _y
          _y = yScale
          return _chart
        }

        _chart.addSeries = function (series) {
            _data.push(series)
            return _chart
        }

        _chart.render = function () {
            if (!_svg) {
                _svg = d3.select('body')
                    .append('svg')
                    .attr('width', _width)
                    .attr('height', _height)
                renderAxes()
            }
            renderBody()
        }

        function renderAxes() {
            const axes = _svg.append('g')
                .classed('axes', true)

            axes.append('g')
                .classed('x-axis', true)
                .attr('transform', `translate(${_margins.left}, ${_height - _margins.bottom})`)
                .call(d3.axisBottom().scale(_x.range([0, _width - _margins.left - _margins.right])))

            axes.selectAll('g.x-axis g.tick')
                .append('line')
                    .classed('grid-line', true)
                    .attr('x1', 0)
                    .attr('y1', 0)
                    .attr('x2', 0)
                    .attr('y2', -(_height - _margins.top - _margins.bottom))

            axes.append('g')
                .classed('y-axis', true)
                .attr('transform', `translate(${_margins.left}, ${_margins.top})`)
                .call(d3.axisLeft().scale(_y.range([_height - _margins.top - _margins.bottom, 0])))

            axes.selectAll('g.y-axis g.tick')
                .append('line')
                    .classed('grid-line', true)
                    .attr('x1', 0)
                    .attr('y1', 0)
                    .attr('x2', _width - _margins.left - _margins.right)
                    .attr('y2', 0)
        }

        function renderBody() {
            if (!_body) {
              _body = _svg.append('g')
                .classed('body', true)
                .attr('transform', `translate(${_margins.left}, ${_margins.top})`)
            }
            renderLines()
            renderAreas()
            renderDots()
        }

        function renderLines() {
            const line = d3.line()
                .x((d) => _x(d.x))
                .y((d) => _y(d.y))

            const pathLines = _body.selectAll('path.line')
                .data(data)

            pathLines.enter()
                .append('path')
                .merge(pathLines)
                    .classed('line', true)
                    .style('stroke', (d, i) => _colors(i))
                .transition()
                    .attr('d', d => line(d))
        }

        function renderAreas() {
            const area = d3.area()
                .x(d => _x(d.x))
                .y0(_y(0))
                .y1(d => _y(d.y))

            const pathAreas = _body.selectAll('path.area')
                .data(data)

            pathAreas.enter()
                .append('path')
                .merge(pathAreas)
                    .classed('area', true)
                    .style('fill', (d, i) => _colors(i))
                .transition()
                    .attr('d', d => area(d))

        }

        function renderDots() {
            _data.forEach((data, index) => {
                const circles =_body.selectAll(`circle._${index}`)
                    .data(data)

                circles.enter()
                    .append('circle')
                    .merge(circles)
                        .attr('class', `dot _${index}`)
                        .style('stroke', () => _colors(index))
                    .transition()
                        .attr('cx', d => _x(d.x))
                        .attr('cy', d => _y(d.y))
                        .attr('r', 4.5)
            })
        }

        return _chart
    }

    const numberOfSeries = 2,
          numberOfDataPoint = 11
          data = []

    for (let i = 0; i < numberOfSeries; i++) {
        data.push(d3.range(numberOfDataPoint).map((i) => ({x: i, y: Math.random() * 10})))
    }

    const chart = areaChart()
        .x(d3.scaleLinear().domain([0, 10]))
        .y(d3.scaleLinear().domain([0, 10]))

    data.forEach(series => {
        chart.addSeries(series)
    })

    chart.render()

    function update() {
        for (let i = 0; i < data.length; i++) {
            let series = data[i]
            series.length = 0
            for (let i = 0; i < numberOfDataPoint; i++) {
                series.push({x: i, y: Math.random() * 10})
            }
        }
        chart.render()
    }
</script>
<button onclick="update()">update</button>
</body>
</html>
效果如下:
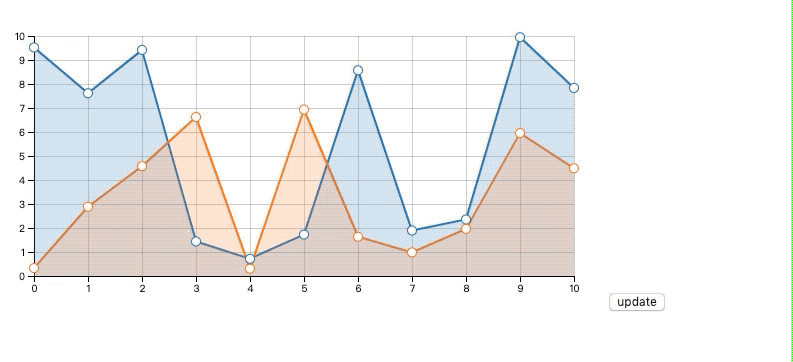
我们用工厂模式,areaChart 返回一个 chart对象,我们可以向其设置渲染数据和一些可以自定义的属性项,渲染的逻辑放在 render() 函数中。
if (!_svg) {
    _svg = d3.select('body')
        .append('svg')
        .attr('width', _width)
        .attr('height', _height)
    renderAxes()
}
renderBody()
坐标轴只会在svg初始化的时候渲染一次。注意我们这里是将坐标轴和图表内容主题分开的。
renderAxes() 里面就是熟悉的渲染坐标轴和栅格线的逻辑。
然后在初始化 body 时,位移到边距的位置,这样可以消除掉边距的影响,因为 body 内的坐标都是以 body 左上角为原点的。
接着,我们分别在renderLine() renderArea() renderDots() 内完成线条、面积、数据点的渲染。都是之前我们熟悉的代码。
散点图
散点图的工厂函数和上面类似,只实现了必须的功能,其余的设置函数可以自行添加。
<!doctype html>
<html lang="en">
<head>
    <meta charset="UTF-8">
    <meta name="viewport"
          content="width=device-width, user-scalable=no, initial-scale=1.0, maximum-scale=1.0, minimum-scale=1.0">
    <meta http-equiv="X-UA-Compatible" content="ie=edge">
    <title>Document</title>
    <style>
        .grid-line{
            stroke: black;
            shape-rendering: crispEdges;
            stroke-opacity: .2;
        }
    </style>
</head>
<body>
<script src="../d3.js"></script>
<script>
    function scatterPlotChart() {
        const _chart = {}

        let _width = 500,
            _height = 500,
            _margins = {top: 30, right: 30, bottom: 30, left: 30},
            _colors = d3.scaleOrdinal(d3.schemeCategory10),
            _x,
            _y,
            _data = [],
            _svg,
            _body,
            _symbolTypes = d3.scaleOrdinal()
                .range(d3.symbols)


        _chart.render = function () {
            if (!_svg) {
                _svg = d3.select('body')
                    .append('svg')
                        .attr('width', _width)
                        .attr('height', _height)
                renderAxes()
            }
            renderBody()
        }

        function renderAxes() {
            const axes = _svg.append('g')
                .classed('axes', true)

            axes.append('g')
                .classed('x-axis', true)
                .attr('transform', `translate(${_margins.left}, ${_height - _margins.bottom})`)
                .call(d3.axisBottom().scale(_x.range([0, _width - _margins.left - _margins.right])))

            axes.selectAll('g.x-axis g.tick')
                .append('line')
                .classed('grid-line', true)
                .attr('x1', 0)
                .attr('y1', 0)
                .attr('x2', 0)
                .attr('y2', -(_height - _margins.top - _margins.bottom))

            axes.append('g')
                .classed('y-axis', true)
                .attr('transform', `translate(${_margins.left}, ${_margins.top})`)
                .call(d3.axisLeft().scale(_y.range([_height - _margins.top - _margins.bottom, 0])))

            axes.selectAll('g.y-axis g.tick')
                .append('line')
                    .classed('grid-line', true)
                    .attr('x1', 0)
                    .attr('y1', 0)
                    .attr('x2', _width - _margins.left - _margins.right)
                    .attr('y2', 0)
        }

        function renderBody() {
            if (!_body) {
                _body = _svg.append('g')
                    .classed('body', true)
                    .attr('transform', `translate(${_margins.left}, ${_margins.right})`)
            }
            renderSymbols()
        }

        function renderSymbols() {
            _data.forEach((data, i) => {
                const symbols = _body.selectAll('path._' + i)
                    .data(data)

                symbols.enter()
                    .append('path')
                    .merge(symbols)
                        .attr('class', 'symbol _' + i)
                        .style('fill', d => _colors(i))
                    .transition()
                        .attr('transform', d => `translate(${_x(d.x)}, ${_y(d.y)})`)
                        .attr('d', d3.symbol().type(_symbolTypes(i)))
            })
        }


        _chart.addSeries = function (series) {
            _data.push(series)
            return _chart
        }

        _chart.x = function (x) {
            if (!arguments.length) return _x
            _x = x
            return _chart
        }

        _chart.y = function (y) {
            if (!arguments.length) return _y
            _y = y
            return _chart
        }

        return _chart
    }

    const numberOfSeries = 5,
          numberOfDataPoint = 11,
          data = []

    for (let i = 0; i < numberOfSeries; i++) {
        data.push(d3.range(numberOfDataPoint).map(i => ({x: Math.random() * 10, y: Math.random() * 10})))
    }

    const chart = scatterPlotChart()
        .x(d3.scaleLinear().domain([0, 10]))
        .y(d3.scaleLinear().domain([0, 10]))

    data.forEach(series => {
        chart.addSeries(series)
    })

    chart.render()
</script>
</body>
</html>
效果如下:
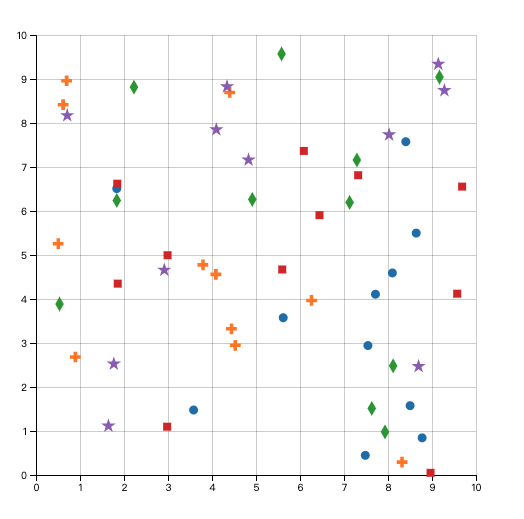
主要代码如下:
const _symbolTypes = d3.scaleOrdinal()
        .range(d3.symbols)

function renderSymbols() {
    _data.forEach((data, i) => {
        const symbols = _body.selectAll('path._' + i)
            .data(data)

        symbols.enter()
            .append('path')
            .merge(symbols)
                .attr('class', 'symbol _' + i)
                .style('fill', d => _colors(i))
            .transition()
                .attr('transform', d => `translate(${_x(d.x)}, ${_y(d.y)})`)
                .attr('d', d3.symbol().type(_symbolTypes(i)))
    })
}
我们先创建了个有序尺度,它对应着不同的符号形状,d3.symbols 是 d3 内置符号形状的数组。
在 renderSymbol() 函数中 我们为每个数据项都创建 path 并调用 symbol 生成器为属性 d 赋值。symbol.type(_symbolTypes(i))来设置 symbol 的类型为索引所对应着的尺度中的类型。
气泡图
<!doctype html>
<html lang="en">
<head>
    <meta charset="UTF-8">
    <meta name="viewport"
          content="width=device-width, user-scalable=no, initial-scale=1.0, maximum-scale=1.0, minimum-scale=1.0">
    <meta http-equiv="X-UA-Compatible" content="ie=edge">
    <title>Document</title>
    <style>
        .grid-line{
            stroke: black;
            shape-rendering: crispEdges;
            stroke-opacity: .2;
        }
    </style>
</head>
<body>
<script src="../d3.js"></script>
<script>
  function scatterPlotChart() {
    const _chart = {}

    let _width = 500,
      _height = 500,
      _margins = {top: 30, right: 30, bottom: 30, left: 30},
      _colors = d3.scaleOrdinal(d3.schemeCategory10),
      _x,
      _y,
      _r,
      _data = [],
      _svg,
      _body


    _chart.render = function () {
      if (!_svg) {
        _svg = d3.select('body')
          .append('svg')
          .attr('width', _width)
          .attr('height', _height)
        renderAxes()
      }
      renderBody()
    }

    function renderAxes() {
      const axes = _svg.append('g')
        .classed('axes', true)

      axes.append('g')
        .classed('x-axis', true)
        .attr('transform', `translate(${_margins.left}, ${_height - _margins.bottom})`)
        .call(d3.axisBottom().scale(_x.range([0, _width - _margins.left - _margins.right])))

      axes.selectAll('g.x-axis g.tick')
        .append('line')
          .classed('grid-line', true)
          .attr('x1', 0)
          .attr('y1', 0)
          .attr('x2', 0)
          .attr('y2', -(_height - _margins.top - _margins.bottom))

      axes.append('g')
        .classed('y-axis', true)
        .attr('transform', `translate(${_margins.left}, ${_margins.top})`)
        .call(d3.axisLeft().scale(_y.range([_height - _margins.top - _margins.bottom, 0])))

      axes.selectAll('g.y-axis g.tick')
        .append('line')
          .classed('grid-line', true)
          .attr('x1', 0)
          .attr('y1', 0)
          .attr('x2', _width - _margins.left - _margins.right)
          .attr('y2', 0)
    }

    function renderBody() {
      if (!_body) {
        renderBodyClip()
        _body = _svg.append('g')
          .classed('body', true)
          .attr('transform', `translate(${_margins.left}, ${_margins.right})`)
          .attr('clip-path', 'url(#body-clip)')
      }
      renderBubbles()
    }

    function renderBodyClip() {
      _svg.append('defs')
        .append('clipPath')
          .attr('id', 'body-clip')
        .append('rect')
          .attr('x', 0)
          .attr('y', 0)
          .attr('width', _width - _margins.left - _margins.right)
          .attr('height', _height - _margins.top - _margins.bottom)
    }

    function renderBubbles() {
      _r.range([0, 20])

      _data.forEach((data, i) => {
        const bubbles = _body.selectAll('circle._' + i)
          .data(data)

        bubbles.enter()
          .append('circle')
          .merge(bubbles)
            .attr('class', 'circle _' + i)
            .style('stroke', _colors(i))
            .style('fill', _colors(i))
          .transition()
            .attr('cx', d => _x(d.x))
            .attr('cy', d => _x(d.y))
            .attr('r', d => _r(d.r))
      })
    }

    _chart.addSeries = function (series) {
      _data.push(series)
      return _chart
    }

    _chart.x = function (x) {
      if (!arguments.length) return _x
      _x = x
      return _chart
    }

    _chart.y = function (y) {
      if (!arguments.length) return _y
      _y = y
      return _chart
    }

    _chart.r = function (r) {
      if (!arguments.length) return _r
      _r = r
      return _chart
    }

    return _chart
  }


    const numberOfSeries = 5,
        numberOfDataPoint = 11,
        data = []

    for (let i = 0; i < numberOfSeries; i++) {
        data.push(d3.range(numberOfDataPoint).map(i => ({x: Math.random() * 10, y: Math.random() * 10, r: Math.random() * 10})))
    }

    const chart = scatterPlotChart()
        .x(d3.scaleLinear().domain([0, 10]))
        .y(d3.scaleLinear().domain([0, 10]))
        .r(d3.scalePow().exponent(2).domain([0, 10]))

    data.forEach(series => {
        chart.addSeries(series)
    })

    chart.render()
</script>
</body>
</html>
效果如下:
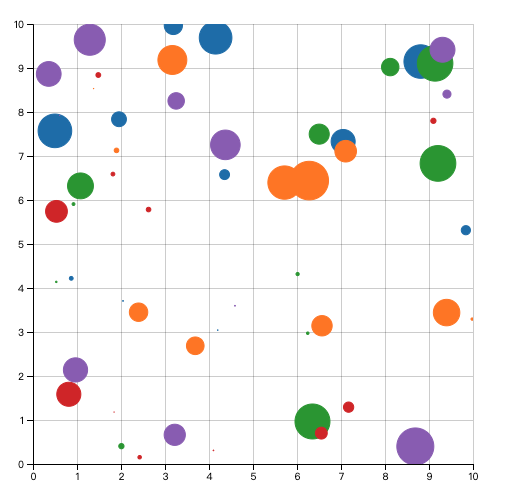
气泡图的渲染和之前相比也只是多了个 r 属性的赋值,另外,我们还给 body 添加了个裁剪区域,用来限制图形越出 body,如下:
_svg.append('defs')
    .append('clipPath')
      .attr('id', 'body-clip')
    .append('rect')
      .attr('x', 0)
      .attr('y', 0)
      .attr('width', _width - _margins.left - _margins.right)
      .attr('height', _height - _margins.top - _margins.bottom)

_body = _svg.append('g')
    .classed('body', true)
    .attr('transform', `translate(${_margins.left}, ${_margins.right})`)
    .attr('clip-path', 'url(#body-clip)')
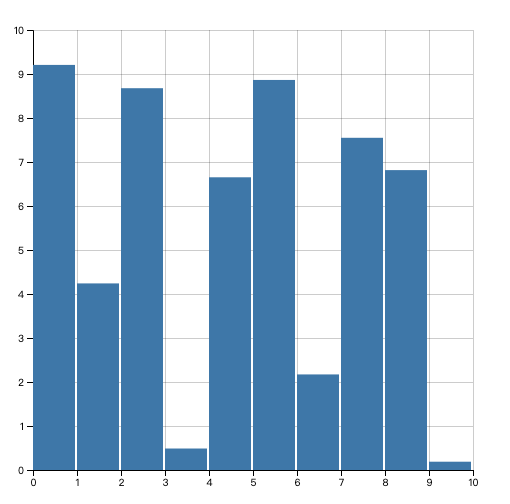
条形图
<!doctype html>
<html lang="en">
<head>
    <meta charset="UTF-8">
    <meta name="viewport"
          content="width=device-width, user-scalable=no, initial-scale=1.0, maximum-scale=1.0, minimum-scale=1.0">
    <meta http-equiv="X-UA-Compatible" content="ie=edge">
    <title>Document</title>
    <style>
        .grid-line{
            stroke: black;
            shape-rendering: crispEdges;
            stroke-opacity: .2;
        }
        .bar {
            fill: #4682b4;
        }
    </style>
</head>
<body>
<script src="../d3.js"></script>
<script>
  function scatterPlotChart() {
    const _chart = {}

    let _width = 500,
      _height = 500,
      _margins = {top: 30, right: 30, bottom: 30, left: 30},
      _x,
      _y,
      _data = [],
      _svg,
      _body


    _chart.render = function () {
      if (!_svg) {
        _svg = d3.select('body')
          .append('svg')
          .attr('width', _width)
          .attr('height', _height)
        renderAxes()
      }
      renderBody()
    }

    function renderAxes() {
      const axes = _svg.append('g')
        .classed('axes', true)

      axes.append('g')
        .classed('x-axis', true)
        .attr('transform', `translate(${_margins.left}, ${_height - _margins.bottom})`)
        .call(d3.axisBottom().scale(_x.range([0, _width - _margins.left - _margins.right])))

      axes.selectAll('g.x-axis g.tick')
        .append('line')
        .classed('grid-line', true)
        .attr('x1', 0)
        .attr('y1', 0)
        .attr('x2', 0)
        .attr('y2', -(_height - _margins.top - _margins.bottom))

      axes.append('g')
        .classed('y-axis', true)
        .attr('transform', `translate(${_margins.left}, ${_margins.top})`)
        .call(d3.axisLeft().scale(_y.range([_height - _margins.top - _margins.bottom, 0])))

      axes.selectAll('g.y-axis g.tick')
        .append('line')
        .classed('grid-line', true)
        .attr('x1', 0)
        .attr('y1', 0)
        .attr('x2', _width - _margins.left - _margins.right)
        .attr('y2', 0)
    }

    function renderBody() {
      if (!_body) {
        _body = _svg.append('g')
          .classed('body', true)
          .attr('transform', `translate(${_margins.left}, ${_margins.right})`)
          .attr('clip-path', 'url(#body-clip)')
        renderBodyClip()
      }
      renderBubbles()
    }

    function renderBodyClip() {
      _svg.append('defs')
        .append('clipPath')
        .attr('id', 'body-clip')
        .append('rect')
        .attr('x', 0)
        .attr('y', 0)
        .attr('width', _width - _margins.left - _margins.right)
        .attr('height', _height - _margins.top - _margins.bottom)
    }

    function renderBubbles() {
        const padding = 2

        const bars = _body.selectAll('rect.bar').data(_data)

        bars.enter()
          .append('rect')
          .merge(bars)
          .classed('bar', true)
          .transition()
          .attr('x', d => _x(d.x))
          .attr('y', d => _y(d.y))
          .attr('height', d => _height - _margins.top - _margins.bottom - _y(d.y))
          .attr('width', d => Math.floor((_width - _margins.left - _margins.right) / _data.length) - padding)
    }


    _chart.addSeries = function (series) {
      _data = series
      return _chart
    }

    _chart.x = function (x) {
      if (!arguments.length) return _x
      _x = x
      return _chart
    }

    _chart.y = function (y) {
      if (!arguments.length) return _y
      _y = y
      return _chart
    }

    return _chart
  }


  const numberOfSeries = 5,
    numberOfDataPoint = 10,
    data = []

  for (let i = 0; i < numberOfSeries; i++) {
    data.push(d3.range(numberOfDataPoint).map(i => ({x: i, y: Math.random() * 10})))
  }

  const chart = scatterPlotChart()
    .x(d3.scaleLinear().domain([0, 10]))
    .y(d3.scaleLinear().domain([0, 10]))

  data.forEach(series => {
    chart.addSeries(series)
  })

  chart.render()
</script>
</body>
</html>
效果如下: