import numpy as np
import matplotlib.pyplot as plt
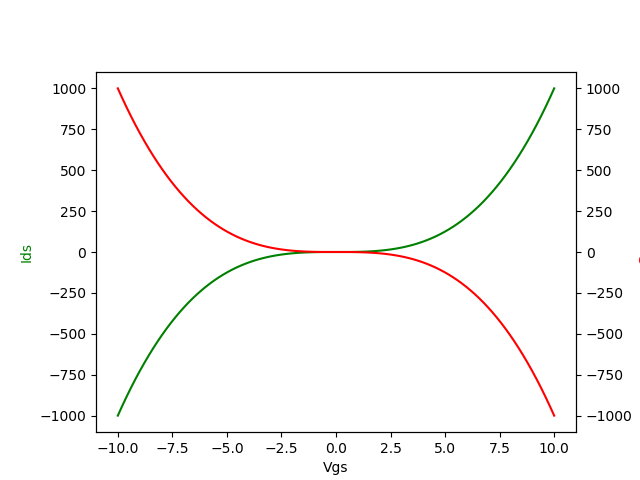
vx=np.linspace(-10,10,100)
vy=vx**3
fig=plt.figure()
ax1=fig.add_axes([0.15,0.1,0.75,0.75])
ax1.plot(vx,vy,'g-')
ax1.set_xlabel('Vgs')
ax1.set_ylabel('Ids',color='g')
ax2=ax1.twinx() ##定义次坐标轴ax2为ax1轴的镜像
ax2.plot(vx,-vy,'r-')
ax2.set_ylabel('Gsg', color='r')
plt.show()