svg预定义标签
矩形
<svg xmlns="http://www.w3.org/2000/svg" version="1.1">
  <rect x="50" y="20" rx="20" ry="20" width="100" height="100" style="fill:red;stroke:black;stroke-width:5;opacity:0.5" />
</svg>
圆形
<svg xmlns="http://www.w3.org/2000/svg" version="1.1">
   <circle cx="100" cy="50" r="40" stroke="black" stroke-width="2" fill="red" />
</svg>
椭圆
<svg xmlns="http://www.w3.org/2000/svg" version="1.1">
  <ellipse cx="240" cy="100" rx="220" ry="30" style="fill:purple" />
  <ellipse cx="220" cy="70" rx="190" ry="20" style="fill:lime" />
  <ellipse cx="210" cy="45" rx="170" ry="15" style="fill:yellow" />
</svg>
线
<svg xmlns="http://www.w3.org/2000/svg" version="1.1">
  <line x1="50" y1="0" x2="150" y2="60" style="stroke:rgb(255,0,0);stroke-width:2" />
</svg>
折线
<svg xmlns="http://www.w3.org/2000/svg" version="1.1">
  <polyline points="0,40 40,40 40,80 80,80 80,120 120,120 120,160" style="fill:white;stroke:red;stroke-width:4" />
</svg>
多边形
<svg  height="210" width="500">
  <polygon points="200,10 250,190 160,210"
  style="fill:lime;stroke:purple;stroke-width:1"/>
</svg>
<svg height="250" width="500">
  <polygon points="220,10 300,210 170,250 123,234" style="fill:lime;stroke:purple;stroke-width:1" />
</svg>
<svg height="210" width="500">
  <polygon points="100,10 40,198 190,78 10,78 160,198"
  style="fill:lime;stroke:purple;stroke-width:5;fill-rule:evenodd;" />
</svg>
路径
<svg xmlns="http://www.w3.org/2000/svg" version="1.1">
    <path d="M150 0 L75 200 L225 200 Z" />
</svg>
d3 如何展示icon标签
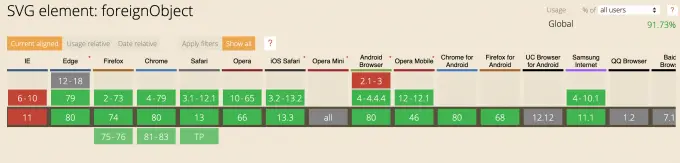
svg foreignObject
his.chart = d3.select("#app-div");//container in html file
this.chart.selectAll(".font-icon")
      .data(this.dataset)// data for graph plotting
.enter().append('foreignObject')
.append('xhtml:span')
.attr('class', 'font-icon)
.style("background-color", "#EA700D")
.style("border-radius", "5px")
.style("padding", "2px")
.style("color", "#ffffff")
.style("font-size", "20px")
.style("width", "20px")
.style("height", "21px")
.style("display", "block")
.attr("width", 30)
.attr("height", 30)
- foreignObject 不可缺
- xhtml:
不可缺,不然显示不出来
- style - width| height ,调整显示的
- 存在兼容问题,firefox,chrome 显示OK,safari显示异常
path形式 – 不存在兼容问题
this.chart.selectAll(".icon")
  .data(this.dataset)// data for graph plotting
.enter().append("svg:path").attr("d", "M150 0 L75 200 L225 200 Z")
.attr("width", 16)
.attr("height", 16)
.attr("class", "dot")
.style("stroke", "red")
url形式
this.chart.selectAll(".icon")
  .data(this.dataset)// data for graph plotting
.enter().append("image").attr("xlink:href", "https://github.com/favicon.ico")
.attr("width", 16)
.attr("height", 16)
.attr("class", "dot")
.style("stroke", "red")
参考
svg菜鸟教程
d3 svg


