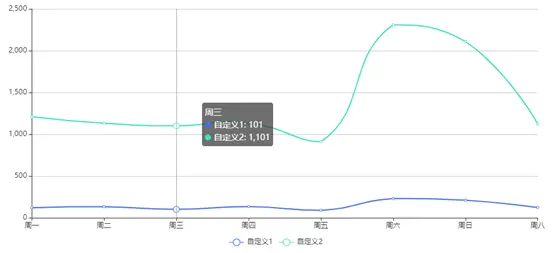
效果图
首先安装echarts
- npm install echarts --save
组件代码
<template>
    <div class="line-echarts">
        <div class="line-echarts-ii" id="lineChart"></div>
    </div>
</template>

<script>
// 按需加载echarts 参考:https://github.com/apache/incubator-echarts/blob/master/index.js
// 使用require方式命名更方便一些
// 引入基本模板
let echarts = require('echarts/lib/echarts');
// 引入柱状图组件
// require('echarts/lib/chart/bar');
// 引入折线图组件
require('echarts/lib/chart/line');

// 引入提示框
require('echarts/lib/component/tooltip');
// 引入title组件
// require('echarts/lib/component/title');
// 引入图标
require("echarts/lib/component/legend");
export default {
    name: 'LineEcharts',
    props: {
        echartData: { // 折线名
            type: Array,
			default: () => [
                {
                    text: '自定义1',
                    color: '#456ef4', // 折线图颜色
                    dataLsit: [120, 132, 101, 134, 90, 230, 210, 123], // 折线图数值
                    getXAxis: ['周一','周二','周三','周四','周五','周六','周日','周八'] // 目前只支持一条横坐标
                },
                {
                    text: '自定义2',
                    color: '#3fe0c2',
                    dataLsit: [1210, 1132, 1101, 1134, 910, 2310, 2110, 1123],
                    getXAxis: ['周一','周二','周三','周四','周五','周六','周日','周八']
                },
                {
                    text: '自定义3',
                    color: 'red',
                    dataLsit: [120, 132, 1101, 134, 910, 210, 110, 1123],
                    getXAxis: ['周一','周二','周三','周四','周五','周六','周日','周八']
                }
            ]
        }
    },
    data() {
        return {
            lineChart: {}
        }
    },
    mounted() {
        this.drawLine();
    },
    methods: {
        drawLine() {
            // 基于准备好的dom,初始化echarts实例
            this.lineChart = echarts.init(document.getElementById('lineChart'));
            // 初始化数据 && 设置窗口自适应大小
            this.lineChart.setOption(this.echartOption, window.onresize = this.lineChart.resize);
        }
    },
    watch: {
        echartOption(newVal, oldVal) {
            let newOption = JSON.stringify(newVal);
            let oldOption = JSON.stringify(oldVal);
            // newVal ,oldVal无function类型,故转化为string来深层对比
            if (newOption !== oldOption) {
                // 数据更改时更新echart
                console.log('updateEchart');
                this.lineChart.setOption(this.echartOption);
            }
        }
    },
    computed: {
        echartOption() {
            let seriesArr = []
            this.echartData.forEach((item) => {
                seriesArr.push({
                        name: item.text,
                        type: 'line',
                        smooth: true, // 平滑
                        itemStyle : {
                            normal : {
                                color: item.color, // 设置折线折点颜色
                                lineStyle:{
                                    color: item.color  // 设置折线线条颜色
                                }
                            }
                        },
                        data: item.dataLsit
                });
            });

            return {
                tooltip: {
                    trigger: 'axis'
                },
                legend: {
                    // x: '0px',图标位置
                    y: '400px',
                    data: this.echartData.map(item => item.text) // 图标名字
                },
                grid: {  // echart四边距离
                    top: '20px',
                    left: '1%',
                    right: '2%',
                    bottom: '30px',
                    containLabel: true
                },
                toolbox: {
                    feature: {
                        saveAsImage: {}
                    }
                },
                xAxis: {
                    type: 'category',
                    boundaryGap: false,
                    data: this.echartData[0].getXAxis // 横坐标都一样。故取默认第一个
                },
                yAxis: {
                    type: 'value'
                },
                series: seriesArr
            }
        }
    }
}

</script>

<style scoped lang="less">
.line-echarts {
    .line-echarts-ii {
        width: 100%;
        height: 420px;
    }
}
</style>


