注意:小程序真机时 canvas 不随页面滚动
- 1
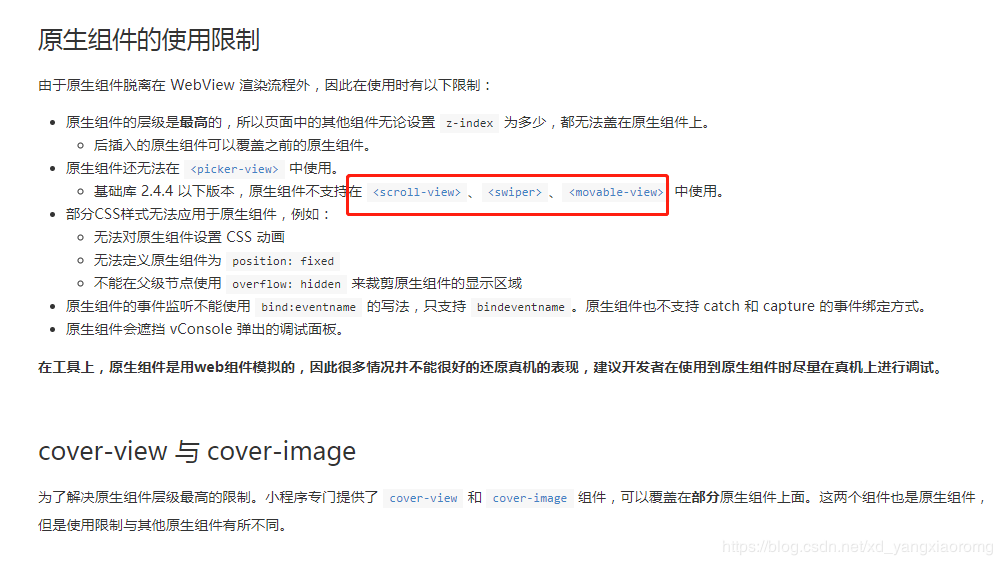
cover-view 也是不行的,会造成canvas悬浮,无法滑动手机屏幕
-
2、看看自己是不是在 config里设置了config = {"disableScroll":true},如果设置了就去掉。
-
3、看看是不是给最外层标签page定义了height:100%的属性或者overflow相关的属性,如果是的话去掉。
-
4、如果上面的方法都用过了还没有解决,那么检查你的canvas的所有父级元素是否设置了height:100%,overflow相关的属性(visible除外),以及position相关的属性(relative,static除外),如果是的话都去掉。
上面条件都满足,应该就能解决你的问题了,但是很多样式就很难写,但是再复杂的页面应该都可以解决的。
- html:
// 注意:外层不能有原生组件
<view v-if="showChart" class="wrap">
    <mpvue-echarts ref="echarts1" :echarts="echarts" :on-init="onInit" />
</view>
- js:
import { mapGetters } from 'vuex'
// 引入echarts文件
const echarts = require(`../../../static/lib/echarts.min.js`)
// 安装依赖后引入
import mpvueEcharts from 'mpvue-echarts'
let chart = null
let chartData = null
function initChart(canvas, width, height) {
chart = echarts.init(canvas, null, {
width: width,
height: height
})
canvas.setChart(chart)
const option = {
// 提示框
// tooltip: {
// trigger: 'item',
// // 鼠标划过的提示框
// show: false,
// formatter: '{b} \n销量 {c}件 \n占比 {d}%'
// },
// 图例
legend: {
orient: 'horizontal',
bottom: '20',
shadowBlur: {
show: true,
shadowColor: 'rgba(0, 0, 0, 0.5)',
shadowBlur: 10
},
itemWidth: 10, // 图例标记的图形宽度
itemHeight: 10, // 图例标记的图形高度
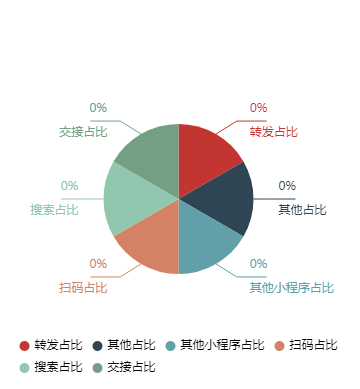
data: [{
name: '转发占比',
icon: 'circle',
textStyle: {
color: '#000'
}
}, {
name: '其他占比',
icon: 'circle',
textStyle: {
color: '#000'
}
}, {
name: '其他小程序占比',
icon: 'circle',
textStyle: {
color: '#000'
}
}, {
name: '扫码占比',
icon: 'circle',
textStyle: {
color: '#000'
}
}, {
name: '搜索占比',
icon: 'circle',
textStyle: {
color: '#000'
}
}, {
name: '交接占比',
icon: 'circle',
textStyle: {
color: '#000'
}
}
]
},
series: [
{
name: '数据',
type: 'pie',
center: ['50%', '50%'],
// 圆环
// radius: ['30%', '40%'],
radius: '40%',
hoverOffset: 10,
labelLine: {
normal: {
show: true,
length: 15,
length2: 30,
lineStyle: {
}
}
},
label: {
normal: {
formatter: '{d}%\n\n{b}',
padding: [0, -20, 0, -20],
rich: {
a: {
color: '#fff',
lineHeight: 22,
align: 'center'
}
}
}
},
data: [
// 此处先前是直接请求到的数据,但是无法直接赋值(此处间接赋值)
{ value: chartData.a, name: '转发占比' },
{ value: chartData.b, name: '其他占比' },
{ value: chartData.c, name: '其他小程序占比' },
{ value: chartData.d, name: '扫码占比' },
{ value: chartData.e, name: '搜索占比' },
{ value: chartData.f, name: '交接占比' }
]
}
]
}
chart.setOption(option)
return chart // 返回 chart 后可以自动绑定触摸操作
}
export default {
mpType: 'page',
config: {
'navigationBarTitleText': '报表'
},
components: {
mpvueEcharts
},
data() {
return {
onInit: initChart,
option: null,
echarts,
ailist: [],
// 控制什么时候触发onInit,对应执行initchart方法
showChart:false
}
},
computed: {
},
onLoad() {
// 先执行一次请求数据
this.clickTab('one')
},
onShow() {
},
onHide() {
this.$actionLoading.hideAll()
},
onUnload() {
this.$actionLoading.hideAll()
Object.assign(this.$data, this.$options.data())
},
methods: {
clickTab(type) {
根据需要请求对应的数据
请求数据时,先不要执行初始化方法initChart;所以先让组件为false。
this.showChart = false
},
// 请求数据
gitaiList() {
this.$actionLoading.show()
const params = this.show
// console.log(params)
// 这里的请求方法是封装过的,可根据自己项目调整
this.$http.get(`请求的链接地址?days=${params}`).then(res => {
// 返回数据处理
if (res.data) {
this.ailist = res.data
// 例如
this.one = res.data.customerSource.forward
this.two = res.data.customerSource.other
// 简介赋值
chartData = { a: this.one, b: this.two}
this.showChart = true
}
}).catch(() => {
// 失败的处理
this.showChart = false
})
},
// 初始化
initChart(canvas, width, height) {
// const that = this
// console.log(` { value: that.forward, name: '其他占比' },`, that.forward)
const chart = echarts.init(canvas, null, {
width: width,
height: height
})
canvas.setChart(chart)
chart.setOption(option)
return chart
}
}
}
css:
.wrap {
  width: 100vw;
  height: 800rpx;
  margin-bottom: 100rpx;
}
制作饼图及踩坑
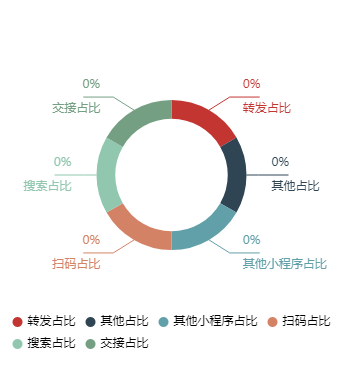
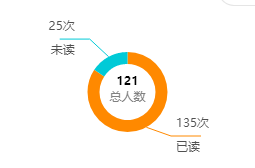
制作环图及踩坑
<view class="pievisitor">
     <mpvue-echarts v-if="showChart" ref="echarts1" :echarts="echarts" :on-init="onInit" canvas-id="radar" @click="no()" />
</view>
import echarts from './lib/echarts.min.js'
import mpvueEcharts from 'mpvue-echarts'
let chart = null
function initChart(canvas, width, height) {
  chart = echarts.init(canvas, null, {
    width: width,
    height: height
  })
  canvas.setChart(chart)
  const option = {
  // 圆环中心文字
    graphic: [
      {
        type: 'text',
        left: 'center',
        top: '40%',
        style: {
          text: 121,
          textAlign: 'center',
          fill: '#000',
          width: 30,
          height: 30,
          fontSize: 12,
          fontWeight: 'bold'
        }
      },
      {
        type: 'text',
        left: 'center',
        top: '50%',
        style: {
          text: '总人数',
          textAlign: 'center',
          fill: '#808080',
          width: 10,
          height: 10
        }
        // textStyle: {
        //   fontSize: 12
        //   // fontWeight:'bold'
        // }
      }
    ],
    series: [
      {
        name: '数据',
        type: 'pie',
        clickable: false,
        center: ['50%', '50%'],
        radius: ['35%', '50%'],
        color: ['#FF8900', '#00CAD7'],
        // '#6283F2', '#F43850', '#FFBD00', '#00CAD7', '#FF8900'
        itemStyle: {
          normal: {
            label: {
              textStyle: {
                color: '#505050',
                fontSize: 12
              }
            }
          }
        },
        // textStyle: {
        //   color: function(value, index) {
        //     return value >= 0 ? 'green' : 'red'
        //   }
        // },
        legendHoverLink: false,
        hoverAnimation: false,
        selectedMode: false,
        hoverOffset: 0,
        selectedOffset: 0,
        silent: true, // 图形是否不响应和触发鼠标事件,默认为 false,即响应和触发鼠标事件 (方法1.解决环图点击出现的圆环内糊住的bug)
        labelLine: {
          normal: {
            show: true,
            length: 20,
            length2: 30,
            lineStyle: {}
          }
        },
        label: {
          normal: {
            formatter: '{c}次\n\n{b}',
            padding: [20, -20, 20, -30],
            rich: {
              a: {
                color: '#fff',
                lineHeight: 22,
                align: 'center'
              }
            }
          }
        },
        data: [
          { value: 135, name: '已读' },
          { value: 25, name: '未读' }
        ]
      }
    ]
  }
  // 点击事件自定义(有需要的可以自定义)
  chart.on('click', function (params) {
    var name = params.name
    var seriesType = params.seriesType
    console.log(name + '\n' + seriesType)
    console.log(params)
  })
  chart.setOption(option)

  return chart // 返回 chart 后可以自动绑定触摸操作
}
export default {
  mpType: 'page',
  config: {
    // navigationStyle: 'custom', // 是否自定义navbar 不需要则删除所有customNav的引用
    // navigationBarTitleText: '营销个人中心',
    backgroundColor: '#fff',
    enablePullDownRefresh: true
  },
  components: {
    mpvueEcharts
  },
  data() {
    return {
      onInit: initChart,
      showChart: true,
      echarts,
      teamlist: ['已读', '未读'],
    }
  },
- 绘制圆环图出现Bug Bug图
解决方案
- 添加阻止点击,防止触发动态效果。如果你需要动态效果当我没说。你可以试试方法二
- 方法一
修改配置 silent: true, // 图形是否不响应和触发鼠标事件,默认为 false,即响应和触发鼠标事件 (方法1.解决环图点击出现的圆环内糊住的bug)
- 方法二
制作一个圆通过定位移动到圆环位置遮盖,注意层级。小程序中使用
cover-view
效果图