假设现在有一个vue的项目,
首先安装echarts,npm install echarts -S,安装完成之后,引入我们需要的echarts。
引入的方式可以用 全局引入 或者 局部引入。
全局引用:
首先在main.js中引入,然后绑定在vue的原型上
import echarts from 'echarts'Vue.prototype.$echarts = echarts接下来,我们就可以在任意组件使用echarts了
局部引用:
很多时候我们没有必要在全局引入echarts,那么就只在单个组件内引入就可以了
const echarts = require('echarts')接下来,我们也就可以在当前组件使用echarts了,这种方法跟全局引入的区别,如果你想在其他的组件使用echarts,就必须重新引入了。
如果你不想一次引入所有的echarts,也可以只引入自己需要的组件,此处以全局引用为例:
在main.js里引入,然后绑定在原型上
// 引入eChartsconst echarts = require('echarts/lib/echarts')// 引入所需eCharts组件require('echarts/lib/component/title')…… require('echarts/lib/component/tooltip')Vue.prototype.$echarts = echarts使用
chart.vue
<template>
<div id="chart-wrap" style="width 500px; height: 500px;" ref="chart"></div>
</template>
<script>
export default {
data() {
return {}
},
mounted() {
this.chart = this.$echarts.init(this.$refs.chart)
window.addEventListener('resize', this.chart.resize)
this.initChart()
},
destroyed() {
window.removeEventListener('resize', this.chart.resize)
this.chart.dispose()
},
methods: {
initChart() {
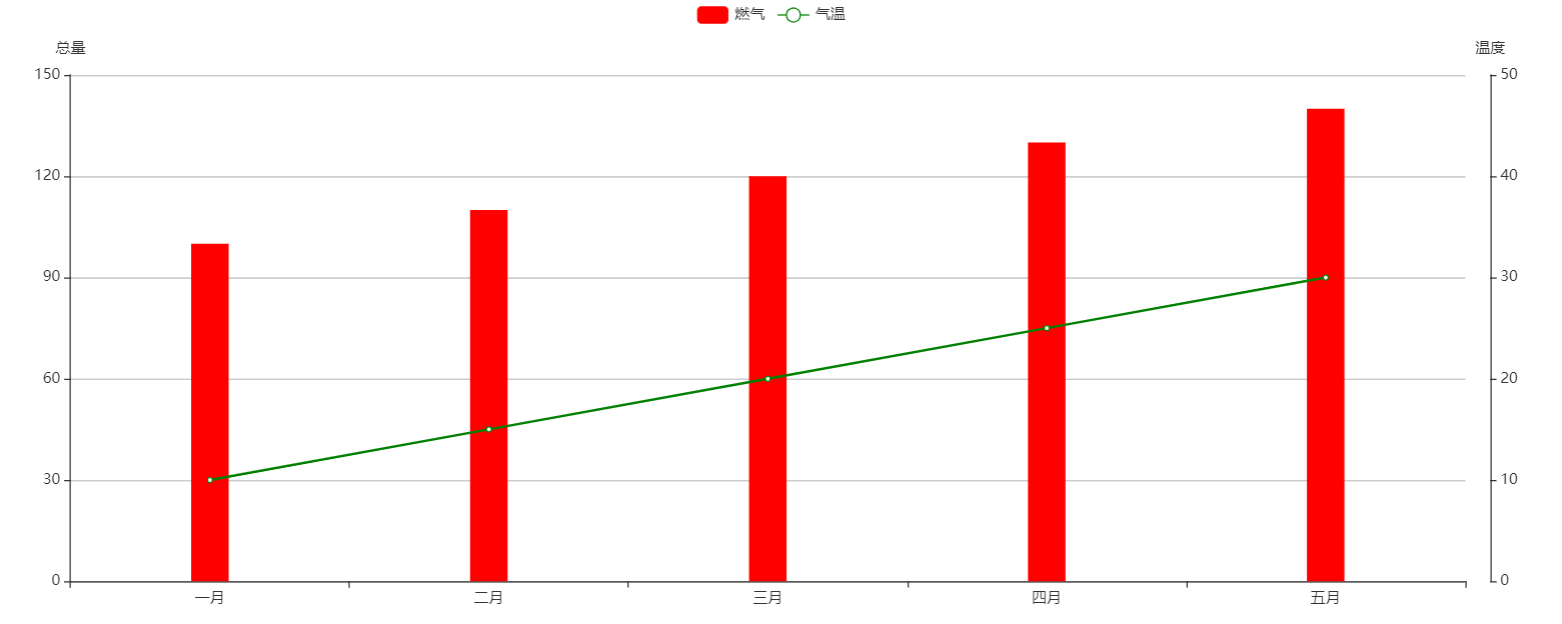
const option = { legend: {
data: ['燃气', '气温']
},
color: ['red', 'green'],
// 横轴
xAxis: {
data: ['一月', '二月', '三月', '四月', '五月']
},
yAxis: [
{
name: '总量',
type: 'value'
}, {
name: '温度',
type: 'value',
offset: 20,
min: 0,
max: 50
}
],
// series中的数据与xAxis里的数据一一对应
series: [
{
name: '燃气',
type: 'bar',
stack: '总量',
barWidth: 30,
data: [100, 110, 120, 130, 140]
}, {
name: '气温',
type: 'line',
yAxisIndex: 1,
data: [10, 15, 20, 25, 30]
}
],
// 控制图表摆放位置
grid: {
left: '3%',
right: '4%',
bottom: '3%',
containLabel: true
},
// 提示框
tooltip: {
trigger: 'axis', // 触发类型 默认数据触发 可选项:item|axis
// 坐标轴指示器 坐标轴触发有效
axisPointer: {
type: 'line' // 默认为直线,可选项:line|shadow
}
}
}
this.chart.setOption(option, true)
}
}}
</script>效果图: