

验证正态分布
为什么要检验数据的正态性?
很多时候,我们都需要使用从单一样本中获取的样本信息利用统计推断的方法来估计总体的参数信息,这是一种非常有用的统计方法,但在执行相关推断之前,我们需要验证一些假定,任何一条假定若是不能满足,则得到的统计结论就是无效的。 通常数据的分析假设为:随机数据,独立的,正态分布,等方差,稳定,当然,测量系统的精确性和准确性也是要满足测量要求的。
什么是正态分布假定?
在再进行统计分析之前,需要识别出数据的分布,否则,错误的统计检验将带来一定的风险,许多统计方法在执行之前嘉定数据服从正态分布,比如,单/双样本-T检验,过程能力分析,I-MR和方差分析等。如果数据不满足正态分布,则需要使用非参数方法,利用中位数进行检验而不是均值,也可以使用BOX-COX转换或JOHNSON变换的方法把数据转换为正态分布。
但是需要知道许多统计工具虽然假定数据满足正态但实际上当样本量大于15或20的时候就不需要正态分布了,但是如果样本量小于15且数据不满足正态分布,P值得数据就是错误的,相关统计结论就需要特别注意了。
# 加载依赖
import pandas as pd
import matplotlib as mpl
import matplotlib.pyplot as plt
import numpy as np
# 读取数据
data = pd.read_csv("http://jse.amstat.org/datasets/normtemp.dat.txt", sep='\s+',names=['body_temperature', 'Gender', 'heart_rate'])
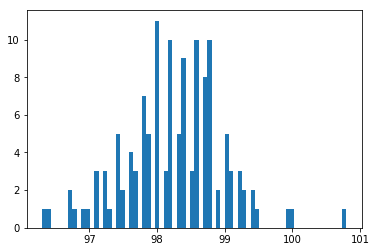
# 展示数据分布的柱型图
plt.hist(data['body_temperature'], bins=70)
plt.show()
验证数据
通过scipy我们有四种方法检测数据的正态性
# KS检验
from scipy.stats import kstest

u = data['body_temperature'].mean()
std = data['body_temperature'].std()
kstest(data['body_temperature'], 'norm',(u,std))

# 返回值
# statistic    float    KS test statistic, either D, D+ or D-.
# pvalue       float    One-tailed or two-tailed p-value.
KstestResult(statistic=0.06472685044047233, pvalue=0.6450307317438667)
kstest 是一个很强大的检验模块,除了正态性检验,还能检验 scipy.stats 中的其他数据分布类型
输出结果中第一个为统计量,第二个为P值(注:统计量越接近0就越表明数据和标准正态分布拟合的越好,如果P值大于显著性水平,通常是0.05,接受原假设,则判断样本的总体服从正态分布)
from scipy.stats import shapiro
shapiro(data['body_temperature'])

# 返回值
#W       float    The test statistic.
#p-value float    The p-value for the hypothesis test.
(0.9865770936012268, 0.233174666762352)
shapiro 是专门用来做正态性检验的模块 注意:shapiro 不适合做样本数>5000的正态性检验,检验结果的P值可能不准确
输出结果中第一个为统计数,第二个为P值,大于0.05
from scipy.stats import anderson
anderson(data['body_temperature'], dist ='norm')

# 返回值
# statistic            float     The Anderson-Darling test statistic
# critical_values      list      The critical values for this distribution
# significance_level   list   The significance levels for the corresponding critical values in percents. The function returns critical values for a differing set of significance levels depending on the distribution that is being tested against.
AndersonResult(statistic=0.5201038826714353, critical_values=array([0.56 , 0.637, 0.765, 0.892, 1.061]), significance_level=array([15. , 10. , 5. , 2.5, 1. ]))
statistic小于critical_values,该检验不能拒绝为正态分布,即该检验未正态分布。
from scipy.stats import normaltest
normaltest(data['body_temperature'],axis=0)

# 返回值
# statistic    float or array    s^2 + k^2, where s is the z-score returned by skewtest and k is the z-score returned by kurtosistest.
# pvalue       float or array    A 2-sided chi squared probability for the hypothesis test.
NormaltestResult(statistic=2.703801433319236, pvalue=0.2587479863488212)
P值大于0.05
