import numpy as np
import pandas as pd
from scipy.stats import normaltest
from scipy import stats
from matplotlib import pyplot as plt
# 读取数据
df = pd.read_csv('http://jse.amstat.org/datasets/normtemp.dat.txt', sep='\s+', header=None,
names=['temprature', 'gender', 'rate'])
# print(df.describe())
print("*" * 100)
print("使用shapiro方法检验体温:")
print(stats.shapiro(df['temprature']))
print("-" * 50)
print("使用normaltest方法检验体温:")
print(normaltest(df['temprature'], axis=None))
print("*" * 100)
print("使用shapiro方法检验心率:")
print(stats.shapiro(df['rate']))
print("-" * 50)
print("使用normaltest方法检验心率:")
print(normaltest(df['rate'], axis=None))
print("*" * 100)
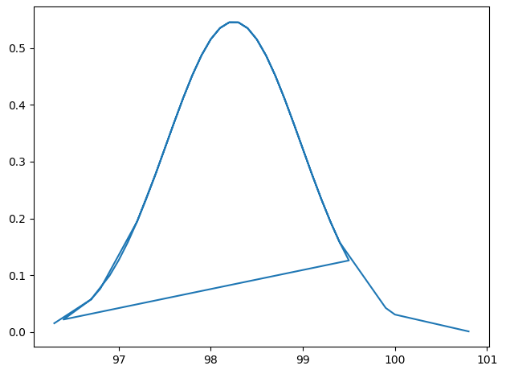
# 利用matplotlib绘制正态分布曲线
x = df['temprature']
y = stats.norm.pdf(x, x.mean(), np.std(x))
plt.plot(x, y)
plt.show()
输出结果
使用shapiro方法检验体温: (0.9865769743919373, 0.2331680953502655)
使用normaltest方法检验体温: NormaltestResult(statistic=2.703801433319236, pvalue=0.2587479863488212)
使用shapiro方法检验心率: (0.9885448217391968, 0.35503581166267395)
使用normaltest方法检验心率: NormaltestResult(statistic=2.3488941072144778, pvalue=0.3089897872482146)