zabbix和nagios功能十分强大,但是要花不少力气去安装,配置,windows和linux上要装不同的agent,还要熟悉它们的配置语法。它们能够检测服务是否运行,CPU、内存、磁盘的状态等等。但我只想检测我的服务是否挂了,比如mysql是否在正常运行,我的网页有没有因为什么异常不可访问了,我需要一个这样的工具,能够配置在一定的时间间隔内去检测服务有没有挂掉,并把信息用邮件发送给你,终于我找到了一个相对于zabbix和nagios简单很多的工具:Jinspector
它是什么?
Jinspector是一款易于使用的Linux和Windows操作系统监控工具。 Jinspector基于SpringBoot,其主要功能是提供一种简单灵活的方式来监控分布式系统上的服务状态。 Jinspector不提供网络利用率,CPU负载或磁盘空间消耗等监控指标。 它只是监控您的服务是否正常工作并发送电子邮件报告。
它有哪些特点?
- 易于安装
- 配置简单
- 跨平台
- 报告友好
- 灵活的检查
- 修改配置后无需重启
谁适合使用它?
- 只想检测有没有服务挂掉
- 主机数量很少
- 想要以简单的方式安装和配置
下面开始使用它 首先你得先确保安装好JDK,JDK需要1.8以上的版本,
然后访问https://github.com/javthon/Jinspector/releases下载最新的jinspector.zip,解压,会发现里面有个jinspector目录下有jinspector.jar和一个config文件夹,config文件夹下是所有的配置文件。可以将整个jinspector目录拷贝到你的服务器上并开始配置。
配置文件 id.yml
这个文件很简单,它只是用来标识你的主机,这里是示例文件:
id: anyid
server.yml
此文件描述将选择哪个主机作为服务器以及服务器将使用哪个端口。 在某些情况下,客户端无法发送检查结果,因为它已因意外原因而关闭,因此需要列出所需的主机ID,它们可以帮助您了解主机的客户端是否正常工作,样例:
server:

  #server id

  id: anyid

  #server ip

  ip: 108.61.174.70

  #Jinspector server will use this port

  port: 2333

  #unique string that identify your clients

  token: zxjawdjawdjgawgnnxuw

requiredHostIds:

  #sometimes a client can't send out inspection results because it has shut down due to

  #unexpected reasons, so a list of required host ids are necessary, they can help you know

  #whether the hosts' clients are working

  #Here are the list of host ids below, host id is configured at id.yml

  - anyid

  - clientid1

  - clientid2
expose.yml
我们可以判断服务是否主要通过其端口在远程主机上运行,如果端口正在侦听将证明服务正在运行,对于Web应用程序,可访问的url告诉服务正常工作,expose.yml中的所有配置都可以 从外部访问,示例配置如下:
# all name and description attributes are not required

connections:

  web:

    # full attributes edition

    - connection:

        name: ASF homepage

        #(required) the url you want to check if it is accessible

        url: http://www.apache.org/

        description: The Apache Software Foundation website

    # simplest attributes edition

    - connection:

        url: https://mvnrepository.com/

    - connection:

        name: unreachable site

        url: https://www.unreachable.com

  ports:

    # full attributes edition

    - connection:

        name: mysql

        #(required)

        host: nanmatou.club

        #(required)

        port: 3306

        description: mysql port

    # simplest attributes edition

    - connection:

        host: nanmatou.club

        port: 3319
local.yml
有些服务无法从外部访问,主机只有私有网络环境,或者像定时任务一样,它不需要使用端口,在这种情况下expose.yml将无法正常工作,所以我们需要配置本地 检查,配置示例文件如下所示:
# all name and description attributes are not required

servers:

  - server:

      # the id is related to the id in id.yml

      id: serverhostid

      name: master

      services:

        # full attributes edition

        - service:

            name: Tomcat

            inspectCommand: jps

            expectedResult: Bootstrap

            description: Is tomcat running?

        # simplest attributes edition

        - service:

            inspectCommand: sudo docker ps

            expectedResult: mysql

        - service:

            inspectCommand: ps -e

            expectedResult: unknow process

  - server:

      id: clienthostid

      name: client1

      services:

        - service:

            inspectCommand: tasklist

            expectedResult: chrome

        - service:

            inspectCommand: netstat -ano

            expectedResult: 49664
本地检查由一组服务器组成,每个服务器都有一个id,在id.yml配置,名称用于告诉您它是哪个主机,它将显示在电子邮件报告中。 每个服务器都有几个服务,每个服务定义你如何检查服务以及服务是否正在运行。例如,我想知道我的docker mysql容器是否在linux上运行,所以我登录到我的linux服务器并键入命令“ docker ps“我看到了这个:
CONTAINER ID IMAGE COMMAND CREATED STATUS PORTS NAMES

b7dea5675023 mysql:5.7 "docker-entrypoint.s…" 5 weeks ago Up 5 weeks 33060/tcp, 0.0.0.0:3318->3306/tcp mysql-service
所以,如果我看到mysql-service,docker mysql容器正在运行,配置块如下所示:
- service:

    name: docker mysql

    inspectCommand: docker ps

    expectedResult: mysql-service

    description: Whether the docker mysql container running
shedule.yml
此文件定义了电子邮件发件人和检查人员,Jinspector有一个内置的电子邮件发件人,如果要设置自己的电子邮件配置,请访问您的邮件服务提供商网站获取帮助,receivers 定义了要在计划节点中发送到的电子邮件地址列表,报告将发送包含所有检查结果的邮件,而检查仅发送有问题的结果
mail:

  sender:

    host: smtp.qq.com

    port: 465

    address: jinspector@foxmail.com

    password: yjrvxfydupwkdfch

    nickname: Jinspector

  receivers:

    - jinspector@foxmail.com

  title: Jinspector

schedule:

  report:

    # 24-hour time display

    initialTime: "16:57"

    # in seconds

    interval: 1*60*3

  inspect:

    initialTime: "10:18"

    interval: 120
这些配置文件在下载到的release中的config目录下都有,修改好配置后,在jinspector目录下执行程序。Linux 用nohup java -jar jinspector.jar & 命令, windows用 java -jar jinspector.jar 命令
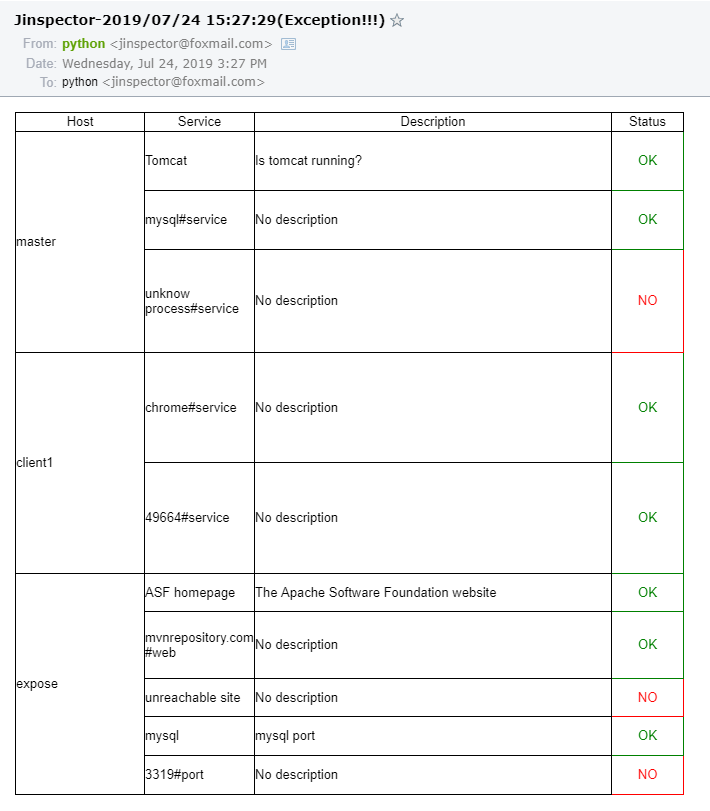
发送后的电子邮件报告: