

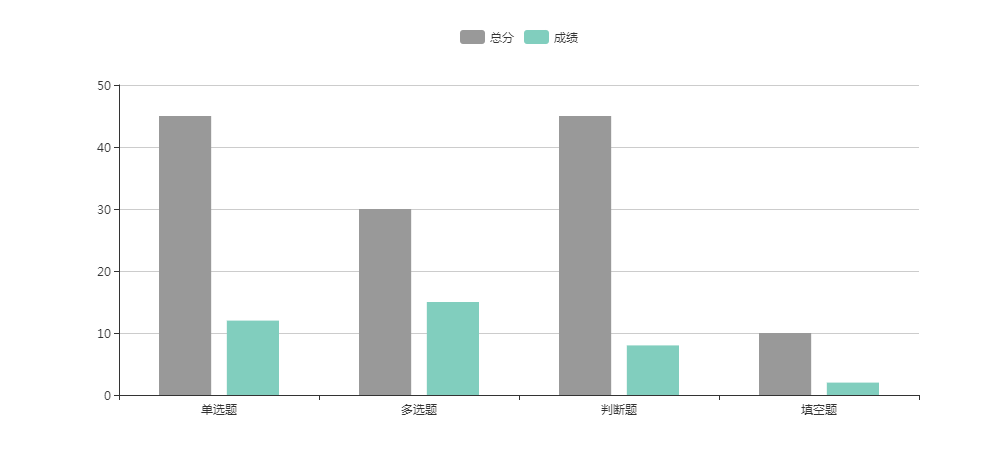
项目中使用到了柱状图是下图这个效果
接下来看代码
1.老规矩先创建一个占位子的div,然后往里面塞东西
<div>
    <div id="report" style="width: 1000px;height: 400px;"></div>
 </div>
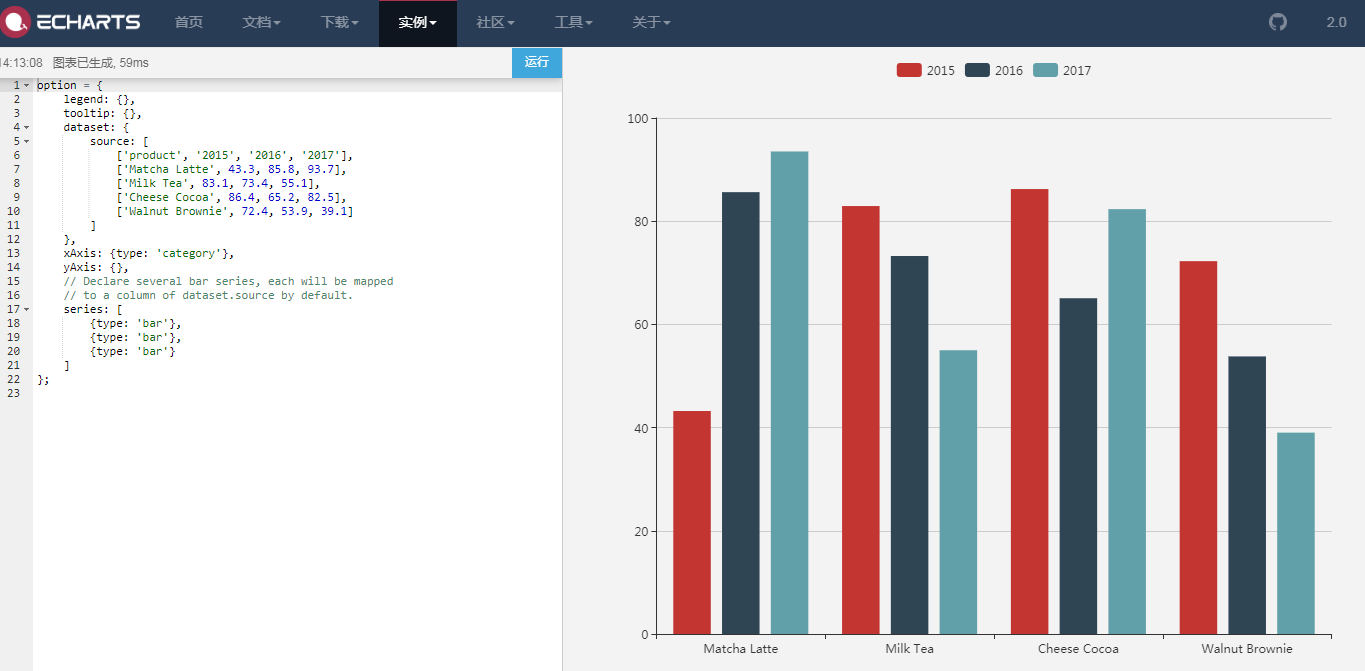
2.引入echarts,并且模拟数据
import echarts from "echarts";
export default {
  name: "",
  data() {
    return {
      charts: "",
      score: "100",
      source: [
        ["题型", "总分", "成绩"],
        ["单选题", 45, 12],
        ["多选题", 30, 15],
        ["判断题", 45, 8],
        ["填空题", 10, 2]
      ]
    };
  },
};
3.定义方法,并且在mounted中调用方法
methods: {
draw(id) {
this.charts = echarts.init(document.getElementById(id));
this.charts.setOption({
legend: {},
tooltip: {},
dataset: {
source: this.source //连接数据
},
xAxis: { type: "category" },
yAxis: {
//这个地方如果需要在Y轴定义最大值就放开,如果需要根据数据自适应的话,就注释掉
// type: "value",
// max: this.score,
// maxInterval: this.score * 0.2,
// minInterval: 1,
// splitNumber: 4
},
grid: { bottom: 30 },
series: [
{
type: "bar", //表示这个是柱状图
barCategoryGap: "40%",
itemStyle: { color: "#999" }, //定义颜色
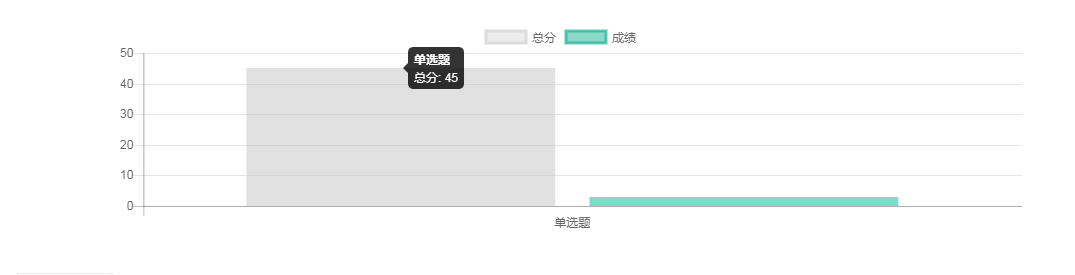
tooltip: {
formatter: params => {
//console.log(params) 打印这个params,按自己需要拼接字符串
return ` ${params.value[0]} <br/>
${params.seriesName}:${params.value[1]}`;
}
}
},
{
type: "bar",
barCategoryGap: "40%",
itemStyle: { color: "#81cebe" },
tooltip: {
formatter: params => {
return ` ${params.value[0]} <br/>
${params.seriesName}:${params.value[2]}`;
}
}
}
]
});
}
},
mounted() {
this.$nextTick(function() {
this.draw("report");
});
}
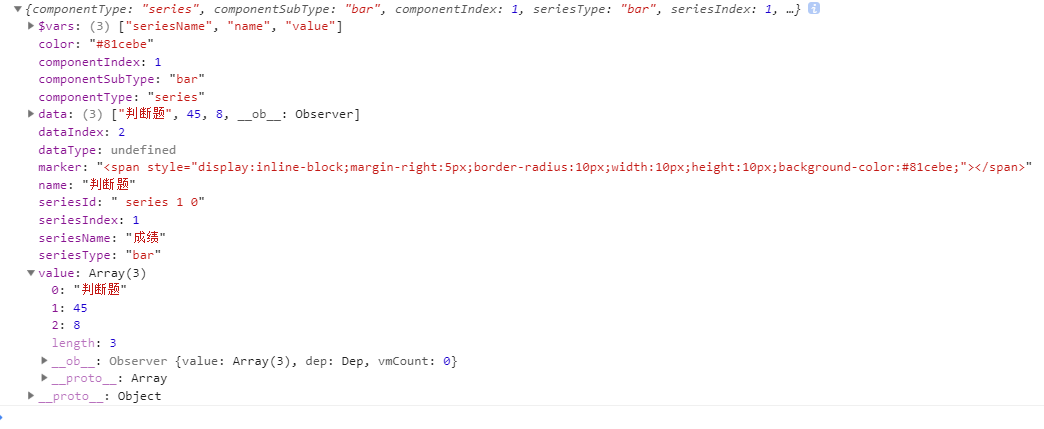
这是我打印的parmas
有帮助的话给爷点个赞吧!
