<!DOCTYPE html>
<html lang="en">

<head>
    <meta charset="UTF-8">
    <meta name="viewport" content="width=device-width, initial-scale=1.0">
    <meta http-equiv="X-UA-Compatible" content="ie=edge">
    <title>饼图或者环形图</title>
    <style>
        canvas {
            border: 1px solid red;
        }
    </style>
</head>

<body>
    <canvas width="500px" height="500px">

  </canvas>

    <script type="text/javascript">
        var canvas = document.querySelector('canvas');
        var ctx = canvas.getContext('2d');
        canvas.width = 600;
        canvas.height = 600;
        canvas.strokeStyle = '1px solid #000';
        var data = [{
            "value": 100,
            "color": "red"
        }, {
            "value": 50,
            "color": "blue"
        }, {
            "value": 15,
            "color": "green"
        }, {
            "value": 20,
            "color": "#ccc"
        }];
        var sum = 185;
        var tempAngle = 0;
        //设置角度的中间变量
        var x0 = 300,
            y0 = 300;
        var radius = 200;
        // 从-90度开始绘制
        for (var i = 0; i < data.length; i++) {
            ctx.beginPath(); //因为设置不同的颜色,所以每次绘制完起一个新状态
            ctx.moveTo(x0, y0);
            //当前扇形的角度
            var angle = data[i].value / 185 * 360;
            ctx.fillStyle = data[i].color;
            //开始从 tempAngle绘制
            var startAngle = tempAngle * Math.PI / 180;
            //从tempAngle绘制到 我们自己的angle区域
            var endAngle = (tempAngle + angle) * Math.PI / 180;
            //参数: x0,y0 圆心坐标,  radius:半径
            // startAngle:开始绘制的弧度
            // endAngle:结束绘制的弧度!!
            ctx.arc(x0, y0, radius, startAngle, endAngle);
            ctx.fill();
            tempAngle += angle; //下一次绘制的起始角度
        }

        //实现环形图
        ctx.beginPath();
        ctx.moveTo(x0, y0);
        ctx.fillStyle = '#fff';
        ctx.arc(x0, y0, radius / 1.5, 0, 2 * Math.PI);
        ctx.fill();
    </script>
</body>

</html>
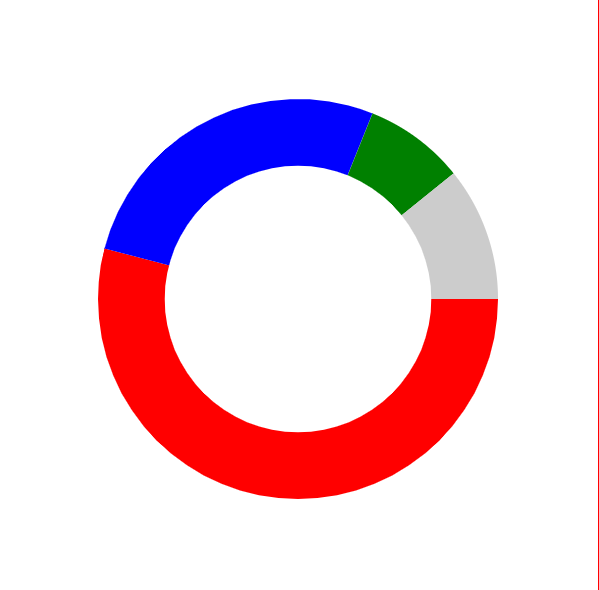
显示结果如下: